

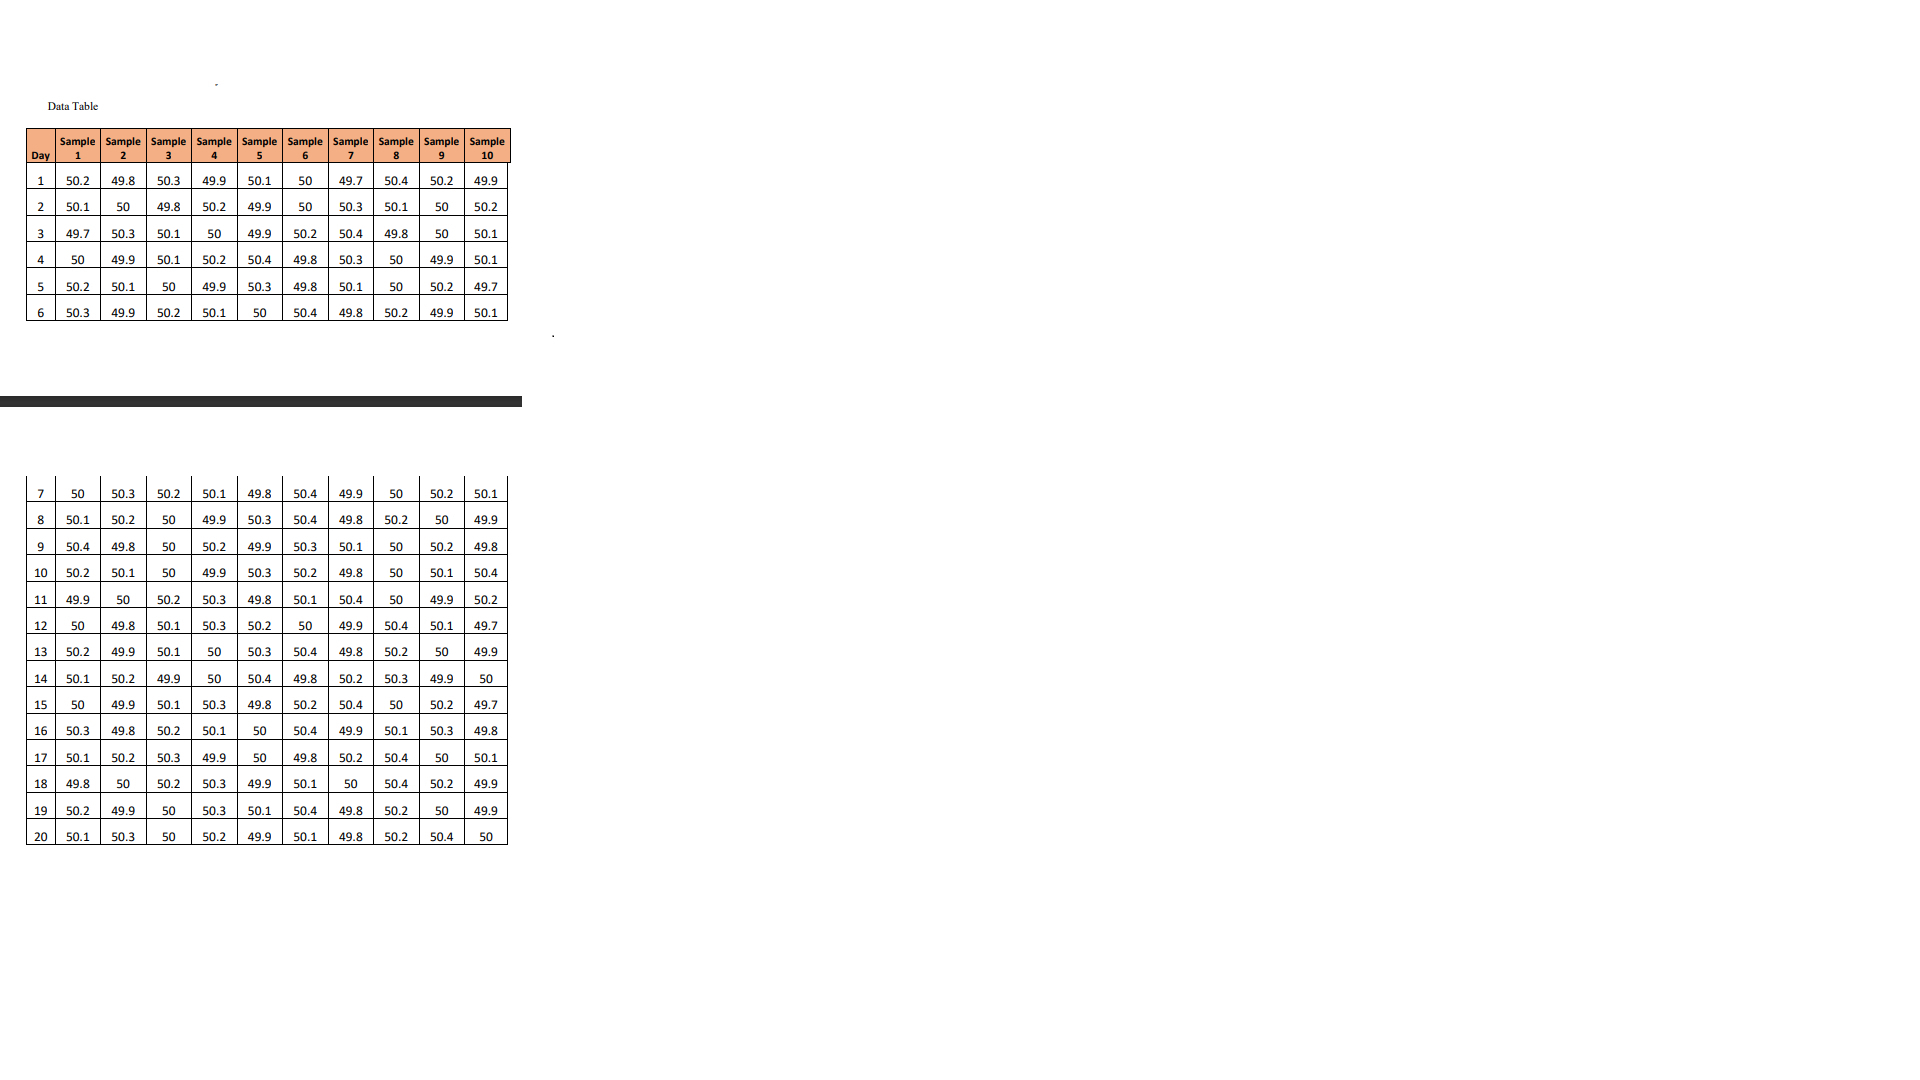
Question: Instructions: 1 . Data Calculation: o For each day, calculate the mean ( X ) and range ( R ) of the 1 0 sample
Instructions: Data Calculation: o For each day, calculate the mean X and range R of the sample values. o Compute the overall average X of all the means and the average range R across the days. Control Limits: o Using the overall averages, calculate the upper and lower control limits for both the Xchart and the Rchart. o Use standard control chart factors eg A D D values for the X and R charts based on the sample size n Construct the Control Charts: o Plot the Xchart and the Rchart using the calculated values. o Ensure that the control limits averages, and individual data points are clearly represented. Interpretation: o Analyze the charts to determine if the process is in control or out of control. o Identify any points that fall outside the control limits and discuss the potential reasons behind these deviations. o Propose any corrective actions if necessary. Deliverables: Complete the calculations for daily averages and ranges. Plot the Xchart and Rchart. Upload your spreadsheet with all the calculations and charts for grading
Step by Step Solution
There are 3 Steps involved in it
1 Expert Approved Answer
Step: 1 Unlock

Question Has Been Solved by an Expert!
Get step-by-step solutions from verified subject matter experts
Step: 2 Unlock
Step: 3 Unlock