

Question: Instructions 1. Use Microsoft Excel to create a line chart with( https://youtu.be/gpyqoVv3jgw ) to an external site.s showing the driver overtime expense (table 1). Describe
Instructions
1. Use Microsoft Excel to create a line chart with( https://youtu.be/gpyqoVv3jgw ) to an external site.s showing the driver overtime expense (table 1). Describe your observations of Table 1.
2. Use Microsoft Excel to create individual line charts with ( https://youtu.be/gpyqoVv3jgw ) to an external site. Showing the average snowfall and non-company highway accidents (table 2). Describe your observations of Table 2. (Hint: Create a line chart individually for average snowfall and a separate one for non-company highway accidents.)
3. As a manager of this cost center, what actions would you consider after viewing the line graphs from Tables 1 and 2 information? (In your answer, describe at least three actions.)
Assume you are the manager of the semi-trucks division at the Speedy Delivery Company. The semi-truck division is a cost center, and you are reviewing the driver overtime costs for the previous year, shown here:
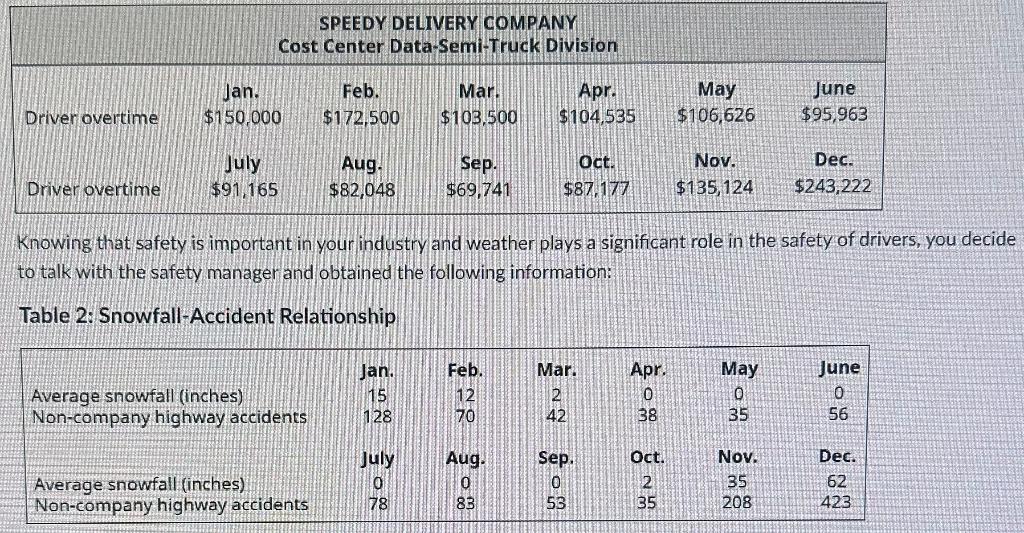
Knowing that safety is important in your industry and weather plays a significant role in the safety of drivers, you dec to talk with the safety manager and obtained the following information: Table 2: Snowfall-Accident Relationship Knowing that safety is important in your industry and weather plays a significant role in the safety of drivers, you dec to talk with the safety manager and obtained the following information: Table 2: Snowfall-Accident Relationship
Step by Step Solution
There are 3 Steps involved in it

Get step-by-step solutions from verified subject matter experts