

Question: important hw problem, can someone help me out? Assume you are the manager for the semi-trucks division at the Speedy Delivery Company. The semi-truck division
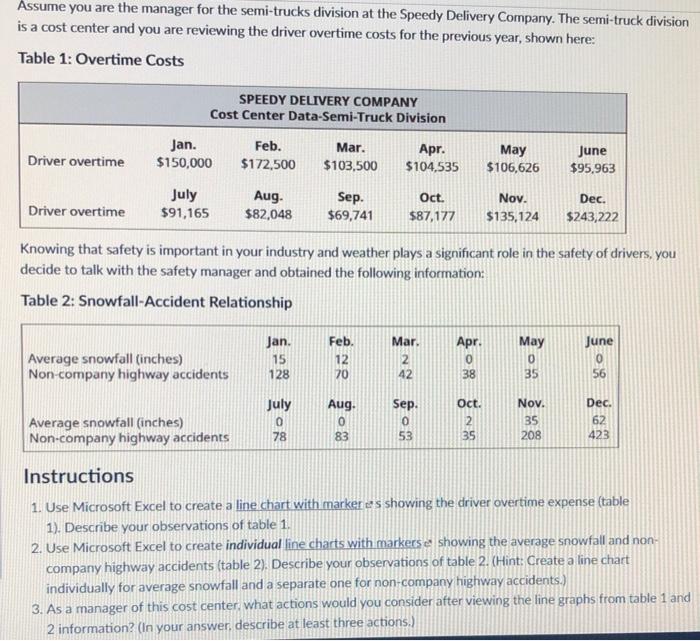
Assume you are the manager for the semi-trucks division at the Speedy Delivery Company. The semi-truck division is a cost center and you are reviewing the driver overtime costs for the previous year, shown here: Table 1: Overtime Costs Driver overtime Driver overtime SPEEDY DELIVERY COMPANY Cost Center Data-Semi-Truck Division Jan. $150,000 July $91,165 Feb. $172,500 Average snowfall (inches) Non-company highway accidents Aug. $82,048 Jan. 15 128 Mar. $103,500 July 0 78 Sep. $69,741 Feb. 12 70 Apr. $104,535 Knowing that safety is important in your industry and weather plays a significant role in the safety of drivers, you decide to talk with the safety manager and obtained the following information: Table 2: Snowfall-Accident Relationship Aug. 0 83 Oct. Nov. $87,177 $135,124 Mar. 2 42 Sep. 0 53 May $106,626 Apr. 0 38 Oct. 2 35 May 0 35 June $95,963 Nov. 35 208 Dec. $243,222 June 0 56 Dec. 62 423 Average snowfall (inches) Non-company highway accidents Instructions 1. Use Microsoft Excel to create a line chart with markers showing the driver overtime expense (table) 1). Describe your observations of table 1. 2. Use Microsoft Excel to create individual line charts with markers showing the average snowfall and non- company highway accidents (table 2). Describe your observations of table 2. (Hint: Create a line chart individually for average snowfall and a separate one for non-company highway accidents.) 3. As a manager of this cost center, what actions would you consider after viewing the line graphs from table 1 and 2 information? (In your answer, describe at least three actions.) Assume you are the manager for the semi-trucks division at the Speedy Delivery Company. The semi-truck division is a cost center and you are reviewing the driver overtime costs for the previous year, shown here: Table 1: Overtime Costs Driver overtime Driver overtime SPEEDY DELIVERY COMPANY Cost Center Data-Semi-Truck Division Jan. $150,000 July $91,165 Feb. $172,500 Average snowfall (inches) Non-company highway accidents Aug. $82,048 Jan. 15 128 Mar. $103,500 July 0 78 Sep. $69,741 Feb. 12 70 Apr. $104,535 Knowing that safety is important in your industry and weather plays a significant role in the safety of drivers, you decide to talk with the safety manager and obtained the following information: Table 2: Snowfall-Accident Relationship Aug. 0 83 Oct. Nov. $87,177 $135,124 Mar. 2 42 Sep. 0 53 May $106,626 Apr. 0 38 Oct. 2 35 May 0 35 June $95,963 Nov. 35 208 Dec. $243,222 June 0 56 Dec. 62 423 Average snowfall (inches) Non-company highway accidents Instructions 1. Use Microsoft Excel to create a line chart with markers showing the driver overtime expense (table) 1). Describe your observations of table 1. 2. Use Microsoft Excel to create individual line charts with markers showing the average snowfall and non- company highway accidents (table 2). Describe your observations of table 2. (Hint: Create a line chart individually for average snowfall and a separate one for non-company highway accidents.) 3. As a manager of this cost center, what actions would you consider after viewing the line graphs from table 1 and 2 information? (In your answer, describe at least three actions.)
Step by Step Solution
There are 3 Steps involved in it

Get step-by-step solutions from verified subject matter experts