Question: INSTRUCTIONS : 1. Using the measures (column 2) of the 4 generic perspectives of (exhibit 13-3), produce a strategy map of measures. I've provided a
INSTRUCTIONS :
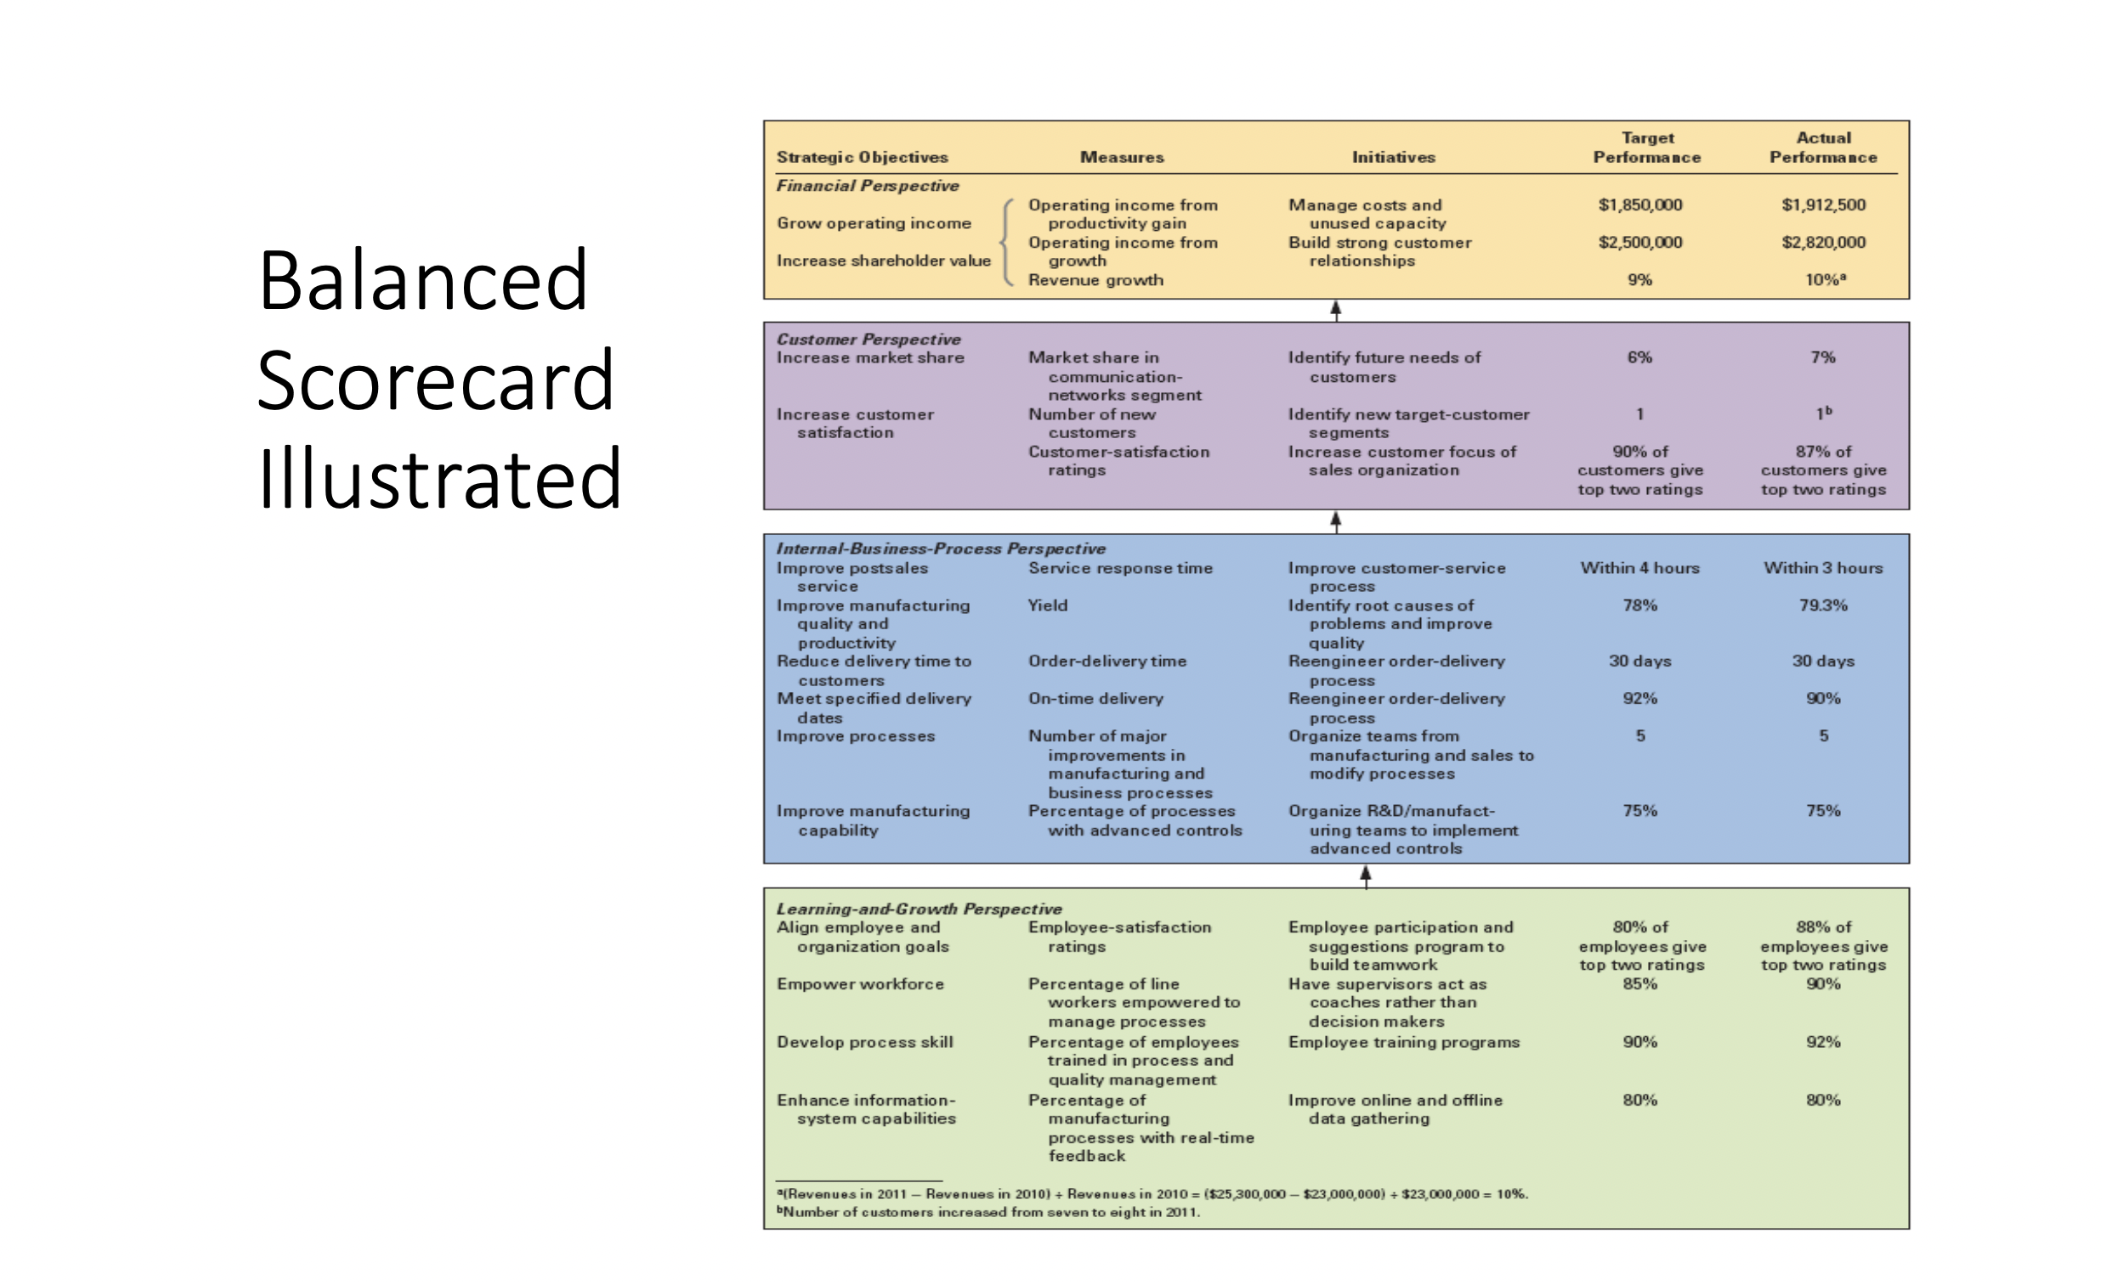
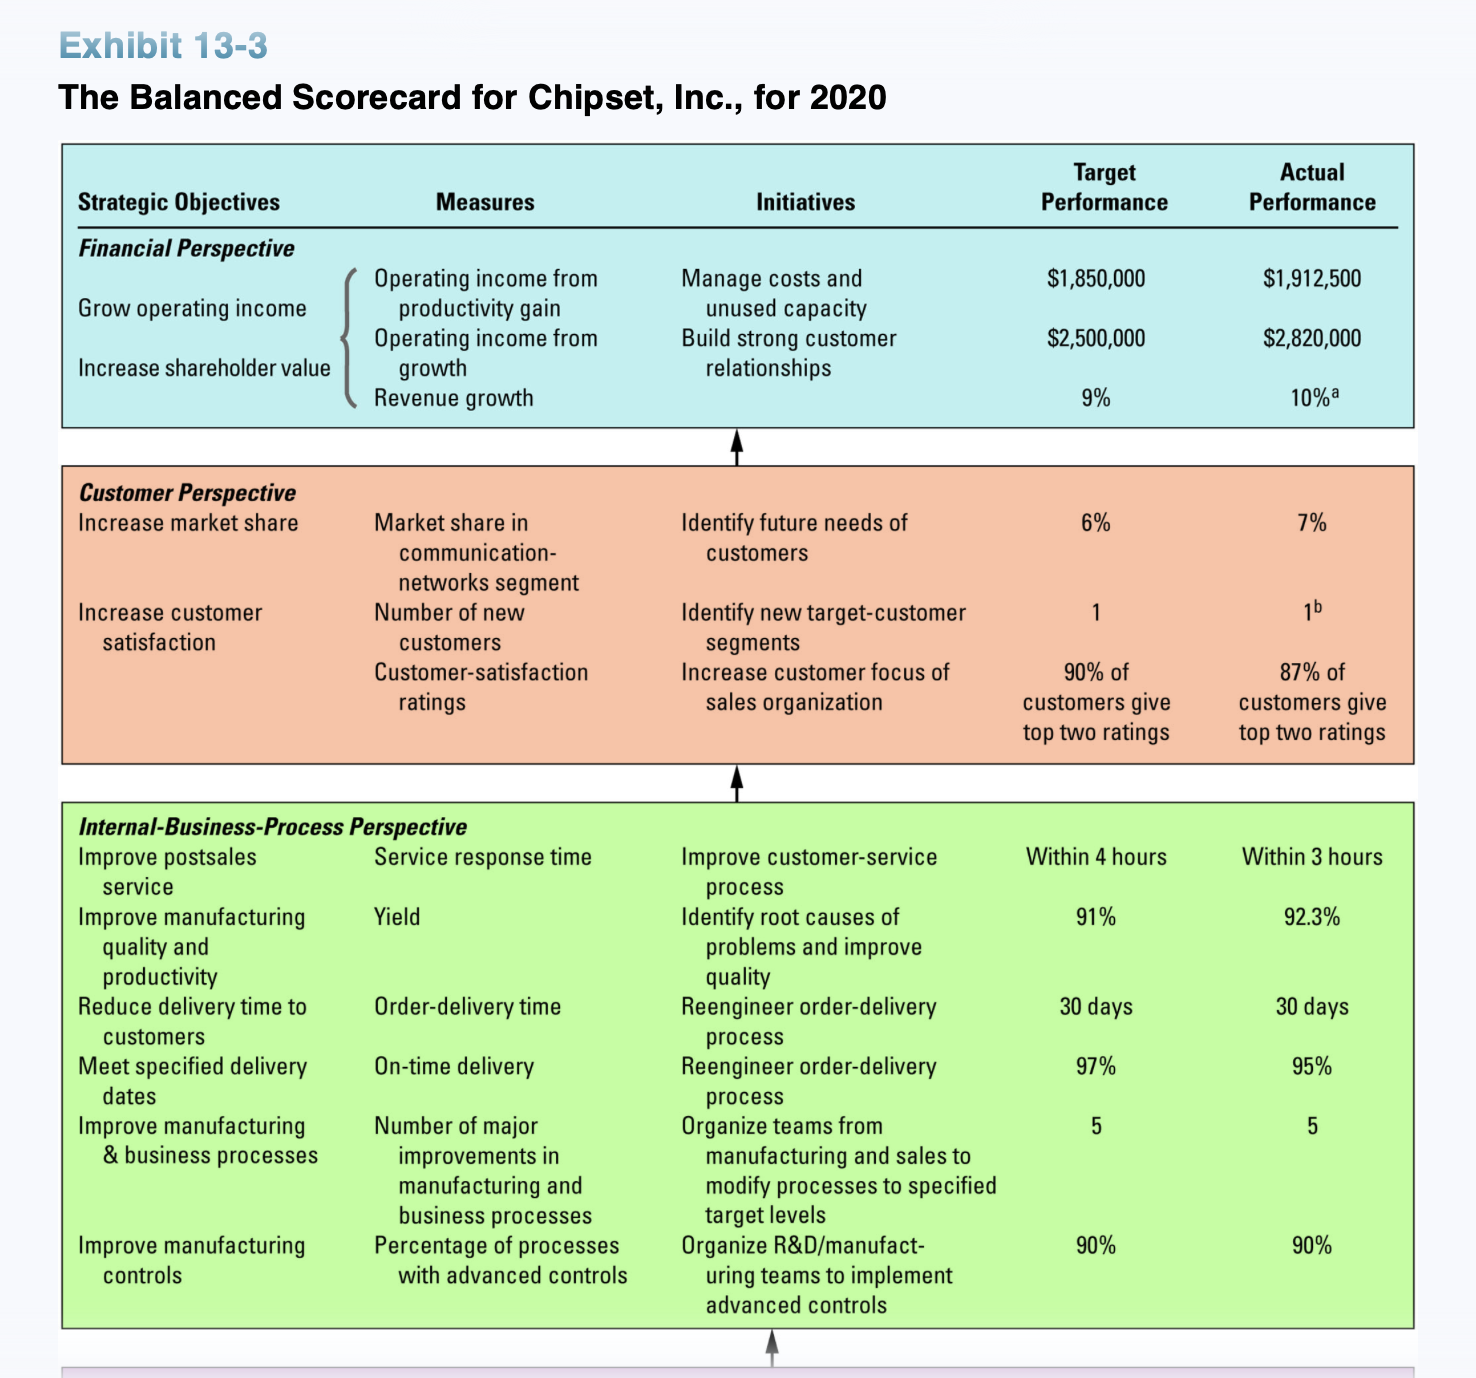
1. Using the measures (column 2) of the 4 generic perspectives of (exhibit 13-3), produce a strategy map of measures. I've provided a strategy map of objectives..2. Label the 4 perspectives appropriately.
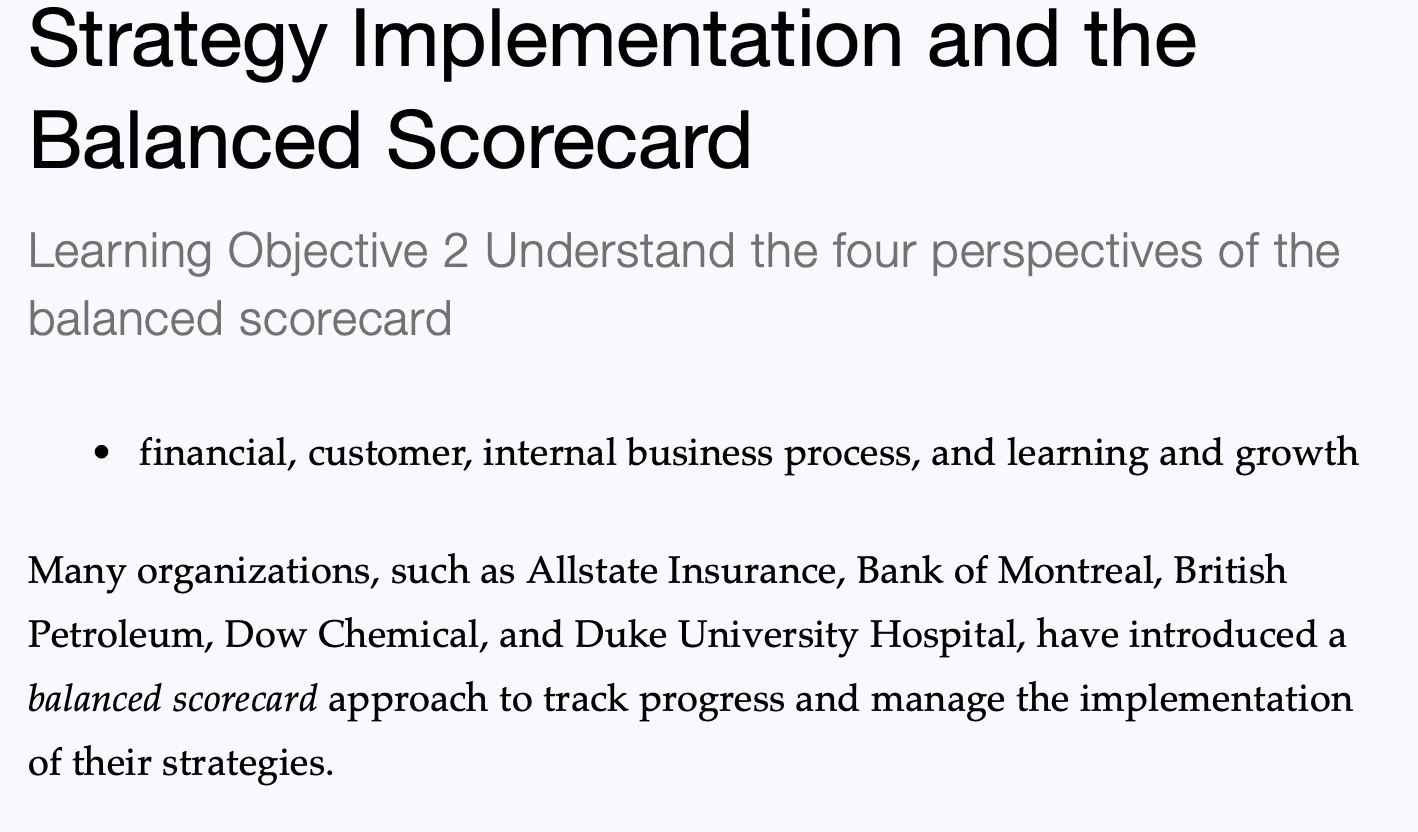
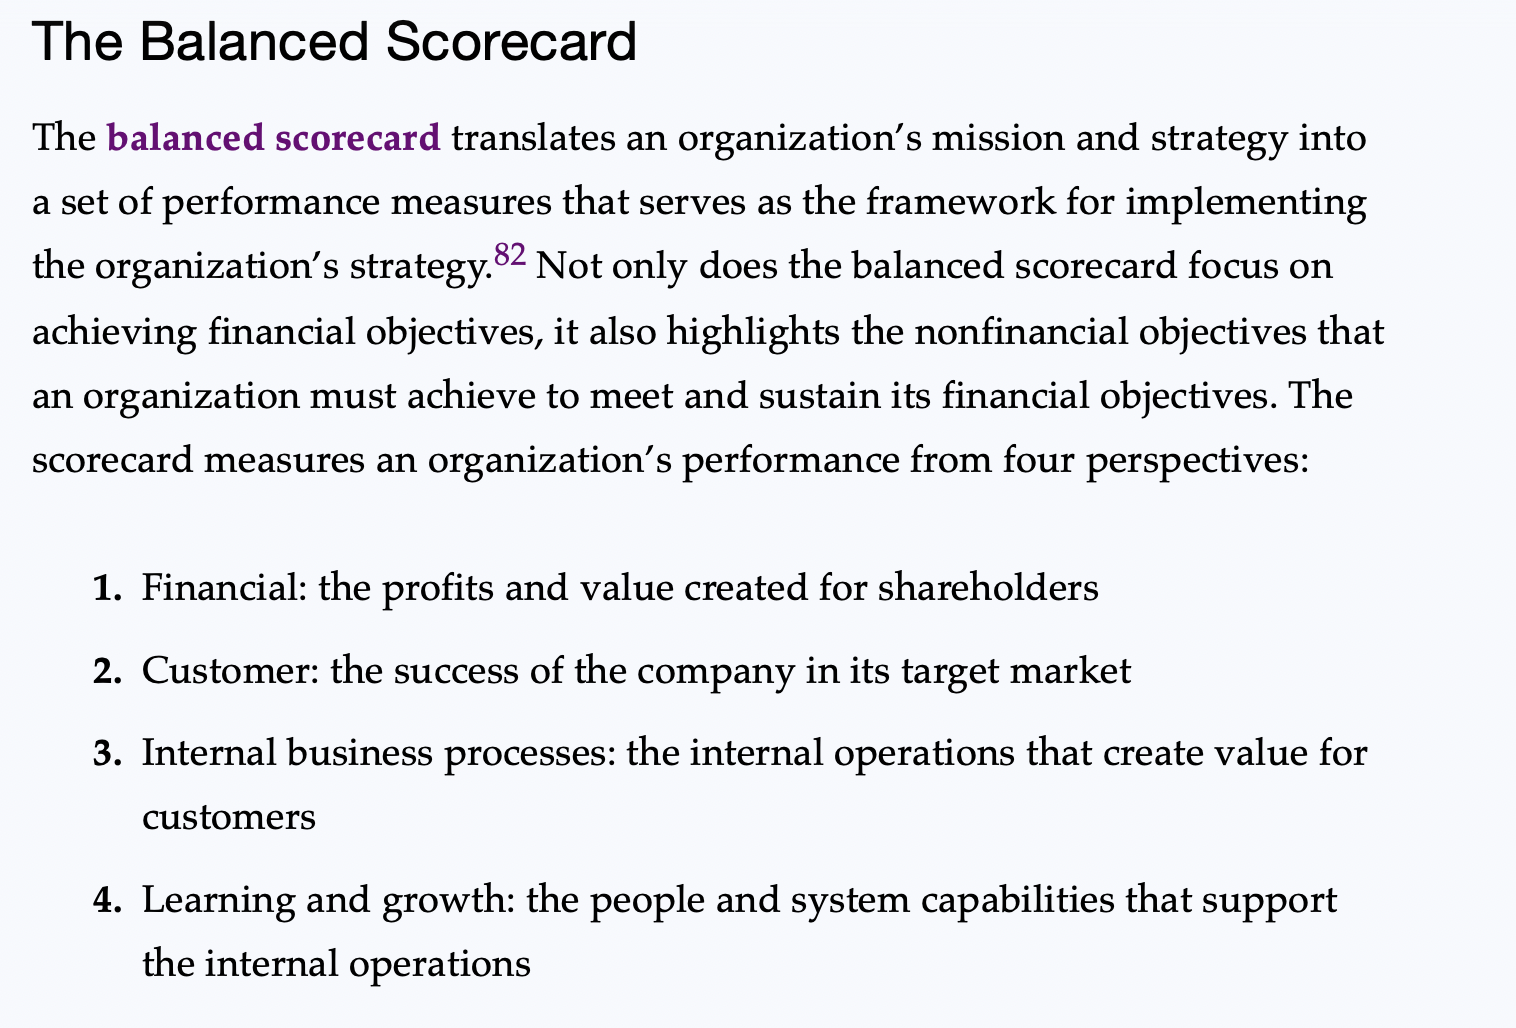
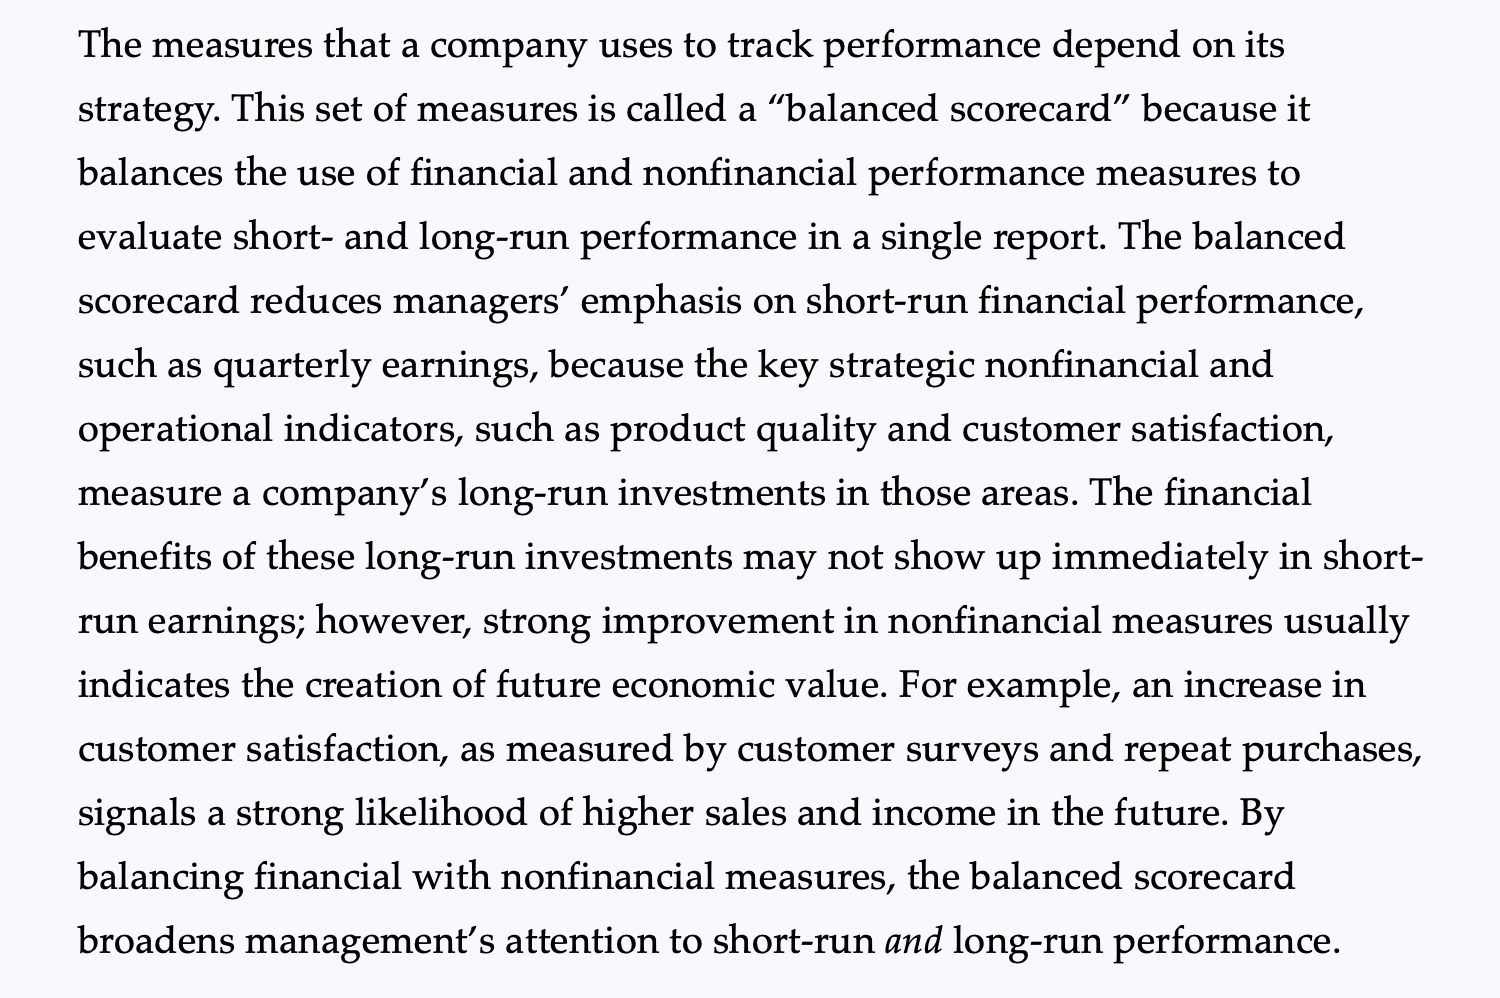
Target Actual Strategic Objectives Measures Initiatives Performance Performance Financial Perspective Operating income from Manage costs and $1,850,000 $1,912,500 Grow operating income productivity gain unused capacity Operating income from Build strong customer $2,500,000 $2,820,000 Balanced Increase shareholder value growth relationships Revenue growth 9% 10% Customer Perspective Scorecard Increase market share Market share in Identify future needs of 6% 7% communication- customers networks segment Number of new Identify new target-customer 1b Increase customer satisfaction customers segments Customer-satisfaction Increase customer focus of 90% of 87% of Illustrated ratings sales organization customers give customers give top two ratings top two ratings Internal-Business-Process Perspective Improve postsales Service response time Improve customer-service Within 4 hours Within 3 hours service process Improve manufacturing Yield Identify root causes of 78% 79.3% quality and problems and improve productivity quality Reduce delivery time to Order-delivery time Reengineer order-delivery 30 days 30 days customers process Meet specified delivery On-time delivery Reengineer order-delivery 92% 90% dates process Improve processes Number of major Organize teams from 5 5 improvements in manufacturing and sales to manufacturing and modify processes business processes Improve manufacturing Percentage of processes Organize R&D/manufact- 75% 75% capability with advanced controls uring teams to implement advanced controls Learning-and-Growth Perspective Align employee and Employee-satisfaction Employee participation and 80% of 88% of organization goals ratings suggestions program to employees give employees give build teamwork top two ratings top two ratings Empower workforce Percentage of line Have supervisors act as 85% 90% workers empowered to coaches rather than manage processes decision makers Develop process skill Percentage of employees Employee training programs 90% 92% trained in process and quality management Enhance information- Percentage of Improve online and offline 80% 80% system capabilities manufacturing data gathering processes with real-time feedback "(Revenues in 2011 - Revenues in 2010) + Revenues in 2010 = ($25,300,000 - $23,000,000) + $23,000,000 = 10%. Number of customers increased from seven to eight in 2011.Strategy Implementation and the Balanced Scorecard Learning Objective 2 Understand the four perspectives of the balanced scorecard 0 financial, customer, internal business process, and learning and growth Many organizations, such as Allstate Insurance, Bank of Montreal, British Petroleum, Dow Chemical, and Duke University Hospital, have introduced a balanced scorecard approach to track progress and manage the implementation of their strategies. The Balanced Scorecard The balanced scorecard translates an organization's mission and strategy into a set of performance measures that serves as the framework for implementing the organization's strategy.82 Not only does the balanced scorecard focus on achieving financial objectives, it also highlights the nonfinancial objectives that an organization must achieve to meet and sustain its financial objectives. The scorecard measures an organization's performance from four perspectives: 1. Financial: the profits and value created for shareholders 2. Customer: the success of the company in its target market 3. Internal business processes: the internal operations that create value for customers 4. Learning and growth: the people and system capabilities that support the internal operations The measures that a company uses to track performance depend on its strategy. This set of measures is called a \"balanced scorecard\" because it balances the use of financial and nonfinancial performance measures to evaluate short- and long-run performance in a single report. The balanced scorecard reduces managers' emphasis on short-run financial performance, such as quarterly earnings, because the key strategic nonfinancial and operational indicators, such as product quality and customer satisfaction, measure a company's long-run investments in those areas. The financial benefits of these long-run investments may not show up immediately in short- run earnings; however, strong improvement in nonfinancial measures usually indicates the creation of future economic value. For example, an increase in customer satisfaction, as measured by customer surveys and repeat purchases, signals a strong likelihood of higher sales and income in the future. By balancing financial with nonfinancial measures, the balanced scorecard broadens management's attention to short-run and long-run performance. In many for-profit companies, the primary goal of the balanced scorecard is to sustain long-run financial performance. Nonfinancial measures simply serve as leading indicators for the hard-to-measure long-run financial performance. Some companies explicitly set social and environmental goals. Some of these companies view meeting social and environmental goals as a means to achieving long-run financial goals because good performance on social and environmental factors attracts customers, employees, and investors to the company. Other companies focus on social and environmental goals because they take the view that a company has obligations to multiple stakeholders, not just financial investors. IAI IIIJII. I U_U The Balanced Scorecard for Chipset, Inc., for 2020 Strategic Objectives Financial Perspective Grow operating in come Increase shareholder value Customer Perspective Increase market share Increase customer satisfaction Measures Operating income from productivity gain Operating income from growth Revenue growth Market share in communication- networks segment Number of new customers Customer-satisfaction ratings Initiatives Manage costs and unused capacity Build strong customer relationships Identify future needs of customers Identify new target-customer segments Increase customerfocus of sales organization Target Performance $1,850,000 $2,500,000 9% 6% 1 90% of customers give top two ratings Actual Performance $1,912,500 $2,820,000 10%3 81% of customers give top two ratings Internsi-Business-Pmcess Perspective Improve postsales service Improve manufacturing quality and productivity Reduce delivery time to customers Meet specified delivery dates Improve manufacturing & business processes Improve manufacturing controls Service response time Yield Urder-deliverytime 0ntime delivery Number of major improvements in manufacturing and business processes Percentage of processes with advanced controls Improve customer-service process Identify root causes of problems and improve quality Fleengineer order-delivery process Fleengineer order-delivery process Organize teams from manufacturing and sales to modify processes to specified target levels Organize R&D/manufact- uring teams to implement advanced controls Within 4 hours 91% 30 days 97% 5 90% Within 3 hours 92.3% 30 days 95% 5 90% l
Step by Step Solution
There are 3 Steps involved in it
1 Expert Approved Answer
Step: 1 Unlock
Question Has Been Solved by an Expert!
Get step-by-step solutions from verified subject matter experts
Step: 2 Unlock
Step: 3 Unlock
Students Have Also Explored These Related Accounting Questions!