

Question: Instructions : Answer the questions below using Microsoft Excel, SAS or another statistical analysis program.The data for questions 1 & 2 are located in an
Instructions: Answer the questions below using Microsoft Excel, SAS or another statistical analysis program.The data for questions 1 & 2 are located in an Excel spreadsheet on Canvas in the Exercises section. You will be using the same dataset for questions 1 and 2. Data for question three is provided below. Make sure you read through each question completely.
- For the following questions, you will be using several methods to investigate the precision/ reliability of 50 individuals who completed replicate 24-hour recalls. Specifically, you will be investigating the reproducibility of total fat intake (g) and Vitamin A intake (RAE)[1] (mcg).
a. Plot the fat intake from the first 24-hour recall on the x-axis and the second 24-hour recall on the y-axis (paste plot below).How well do the estimates of intake seem to correlate (comment without calculating a correlation coefficient)?
b. Plot the Vitamin A intake from the first 24-hour recall on the x-axis and the second 24-hour recall on the y-axis (paste plot below).How well do the estimates of intake seem to correlate (comment without calculating a correlation coefficient)?
c. Use Excel to calculate the Pearson correlation coefficient for dietary fat intake and Vitamin A intake. Based on this information, which has better reliability and why do you think that is the case?
| Pearson r | |
| Total Fat Intake (g) | |
| Vitamin A Intake (RAE) (mcg) |
| 24 Hour Recall- Day 1 | 24 Hour Recall- Day 2 | FFQ | |||
| ID | Total Fat (g) | Vitamin A (RAE) (mcg) | Total Fat (g) | Vitamin A (RAE) (mcg) | Total Fat (g) |
| 21005 | 101.42 | 127 | 93.24 | 200 | 149.12 |
| 21006 | 43 | 245 | 39.7 | 248 | 13.7 |
| 21007 | 32.86 | 199 | 33.86 | 161 | 18.96 |
| 21008 | 107.95 | 455 | 74.51 | 816 | 229.14 |
| 21009 | 235.64 | 835 | 200.6 | 532 | 342.2 |
| 21010 | 60.87 | 423 | 51.13 | 394 | 70.1 |
| 21012 | 113.14 | 336 | 112.68 | 89 | 191.3 |
| 21013 | 103.38 | 38 | 21.79 | 22 | 209.6 |
| 21014 | 70.65 | 406 | 58.73 | 989 | 73.68 |
| 21015 | 45.75 | 650 | 89.17 | 913 | 11.5 |
| 21016 | 70.73 | 586 | 57.21 | 628 | 78.66 |
| 21017 | 70.08 | 99.5 | 74.32 | 151 | 86.34 |
| 21018 | 24.92 | 143 | 72.82 | 982 | 56 |
| 21019 | 23.33 | 56 | 22.01 | 131 | 1.43 |
| 21020 | 132.01 | 965 | 118.65 | 145 | 276.33 |
| 21022 | 47.23 | 349 | 33.9 | 440 | 6.77 |
| 21023 | 141.27 | 617 | 112.32 | 880 | 223.75 |
| 21024 | 43.87 | 553 | 49.76 | 2630 | 50.76 |
| 21025 | 38.28 | 61 | 74.78 | 938 | 9.48 |
| 21026 | 98.43 | 292 | 13.32 | 91 | 218.4 |
| 21027 | 114.42 | 859 | 96.79 | 446 | 189.47 |
| 21028 | 48.28 | 804 | 46.63 | 776 | 63.26 |
| 21029 | 115.8 | 777 | 186.13 | 1391 | 278.54 |
| 21031 | 42.25 | 459 | 36.8 | 576 | 56.23 |
| 21032 | 66.45 | 161 | 31.41 | 230 | 12.4 |
| 21033 | 53.74 | 203 | 49.09 | 588 | 34.69 |
| 21035 | 51.78 | 1328 | 25.3 | 851 | 39.12 |
| 21036 | 66.32 | 283 | 60.93 | 246 | 41.6 |
| 21037 | 75.87 | 706 | 82.63 | 636 | 48.65 |
| 21038 | 93.02 | 201 | 15.95 | 170 | 188.42 |
| 21039 | 46.02 | 1108 | 52.39 | 1382 | 97.43 |
| 21040 | 40.63 | 566 | 54.35 | 510 | 3.82 |
| 21041 | 70.4 | 544 | 41.64 | 214 | 36.6 |
| 21043 | 42.08 | 138 | 52.61 | 342 | 106.6 |
| 21045 | 49.17 | 1086 | 94.11 | 753 | 8.99 |
| 21046 | 49.54 | 441 | 93.19 | 857 | 11.6 |
| 21047 | 102.51 | 107 | 93.21 | 1423 | 171.4 |
| 21048 | 73.06 | 346 | 109.36 | 45 | 69.34 |
| 21049 | 82.87 | 437 | 77.59 | 421 | 52.23 |
| 21050 | 57.43 | 48 | 81.35 | 270 | 32.42 |
| 21051 | 134.11 | 808 | 104.68 | 308 | 263.4 |
| 21052 | 88.56 | 407 | 138.8 | 531 | 38.2 |
| 21054 | 18.37 | 47 | 42.5 | 947 | 3.68 |
| 21055 | 85.87 | 283 | 44.98 | 218 | 114.68 |
| 21057 | 115.96 | 460 | 187.68 | 811 | 197.56 |
| 21058 | 63.64 | 214 | 45.38 | 265 | 41.73 |
| 21059 | 22.97 | 203 | 88.58 | 874 | 99.4 |
| 21060 | 35.86 | 661 | 119.6 | 232 | 5.77 |
| 21061 | 64.06 | 658 | 74.84 | 177 | 40.84 |
| 21062 | 62.96 | 351 | 61.97 | 1370 | 45.5 |
[1] RAE = Retinol Activity Equivalents

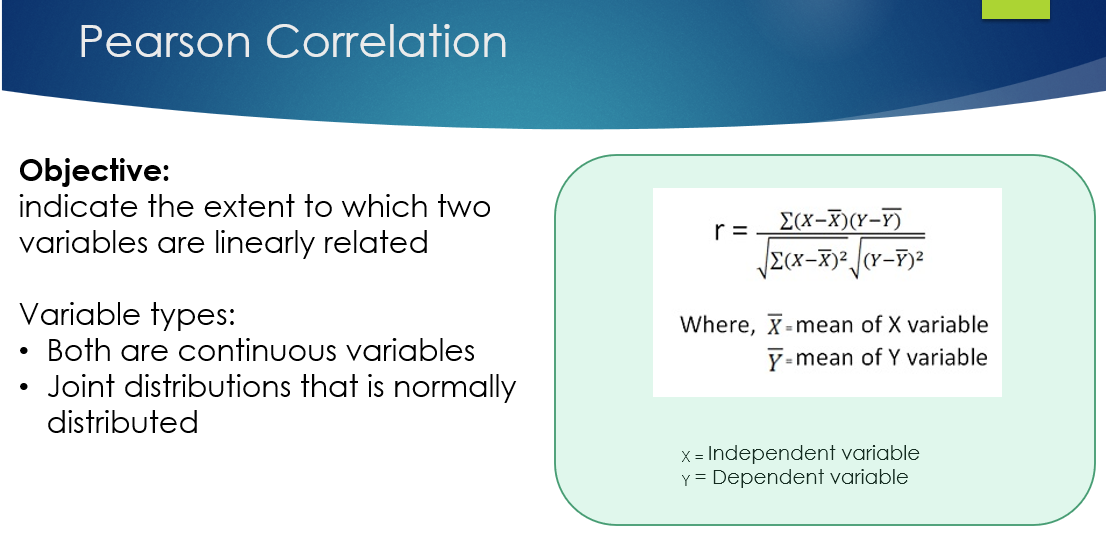
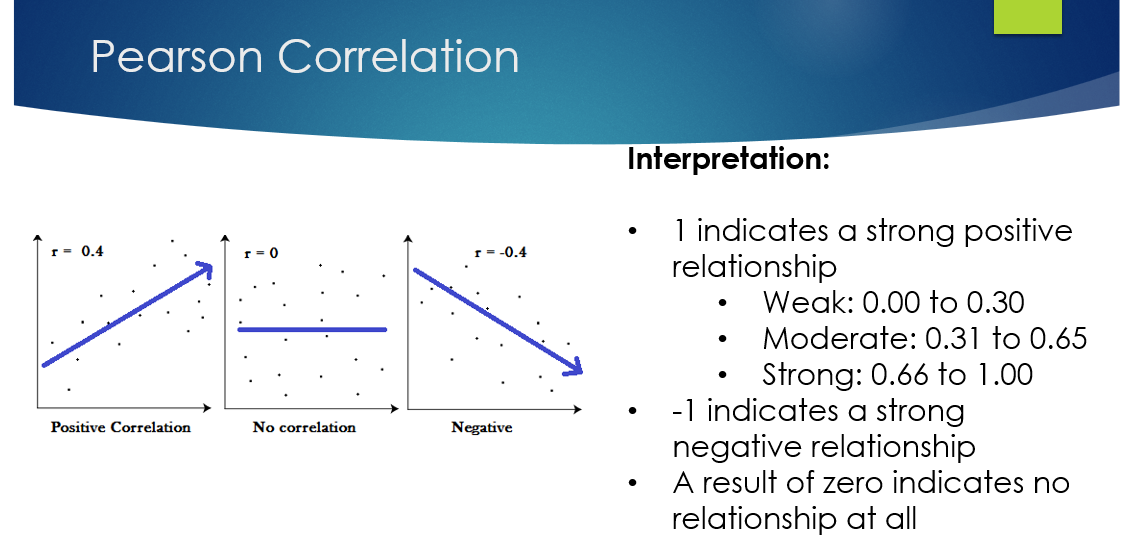
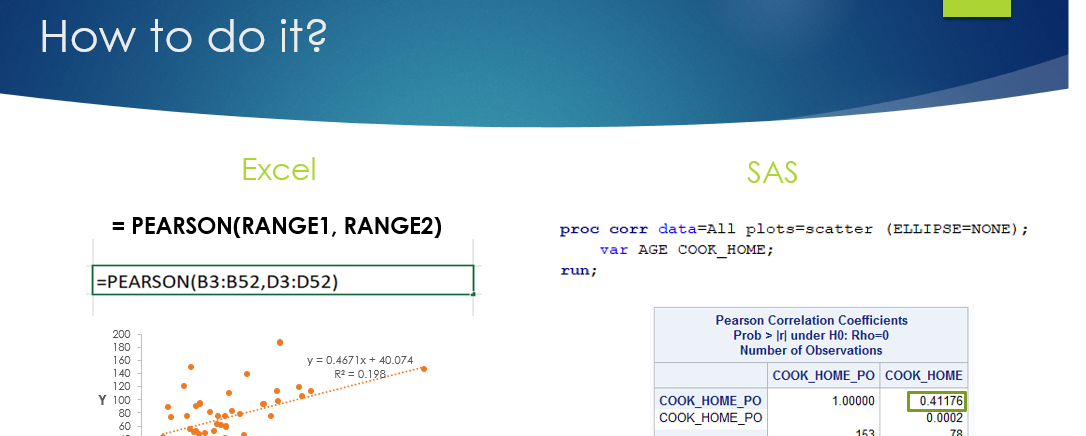
\fPearson Correlation Objective: indicate the extent to which two E ( X - X) ( Y - Y) variables are linearly related r= - E( X - X) 2 ( Y - Y) 2 Variable types: Where, X- mean of X variable . Both are continuous variables Y = mean of Y variable . Joint distributions that is normally distributed x = Independent variable Y = Dependent variablePearson Correlation Positive Correlation o r=-0.4 No correlation Negative Interpretation: | indicates a strong positive relationship Weak: 0.00 t0 0.30 Moderate: 0.31 to 0.65 Strong: 0.66 to 1.00 -1 indicates a strong negative relationship A result of zero indicates no relationship at all How to do it? Excel SAS = PEARSON(RANGE1, RANGE2) proc corr data=All plots=scatter (ELLIPSE=NONE) ; var AGE COOK_HOME; =PEARSON(B3:B52, D3:D52) run; Pearson Correlation Coefficients 200 Prob > Irl under HO: Rho=0 180 Number of Observations 160 y = 0.4671x + 40.074 140 R2 = 0.198........" COOK HOME_PO COOK HOME 120 Y 100 COOK HOME PO 1.00000 0.41176 80 60 COOK_HOME_PO 0.0002
Step by Step Solution
There are 3 Steps involved in it

Get step-by-step solutions from verified subject matter experts