

Question: The table below contains height measurements obtained during a standardization test for anthropometry. 10 subjects were measured twice by an expert and an examiner. a.
The table below contains height measurements obtained during a standardization test for anthropometry. 10 subjects were measured twice by an expert and an examiner.
a. Compute the within-person technical error of measurement (TEM) for both the expert and examiner 1 (i.e. comparing measurement one to measurement two).
*You should estimate the TEM within experts (expert 1 vs expert 2) and the TEM within examiners (examiner 1 vs examiner 2).
b. Interpret results based on suggested cut-offs below.
Note:you can see an example of how to calculate within-person technical error of measurement (TEM) in the excel doc on canvas. File named TEM example calculation
| Subject | Expert: Stature 1 (cm) | Expert: Stature 2 (cm) | Examiner 1: Stature 1 (cm) | Examiner 1: Stature 2 (cm) |
| 1 | 86.4 | 86.3 | 86.5 | 86.3 |
| 2 | 102.3 | 102.3 | 102.3 | 102.6 |
| 3 | 98.1 | 98 | 99 | 98 |
| 4 | 81.7 | 81.6 | 82.5 | 81.6 |
| 5 | 90.1 | 89.9 | 90.1 | 89.4 |
| 6 | 87 | 87.9 | 88 | 88.4 |
| 7 | 94.8 | 94.7 | 94.8 | 94.7 |
| 8 | 95 | 90.5 | 100 | 90.5 |
| 9 | 92.4 | 92.5 | 92.4 | 92.6 |
| 10 | 96.9 | 98.8 | 96.9 | 98.7 |
| (SMART ENA) Suggested cut-off points for acceptability of measurements | ||||
| Parameter | MUAC mm | Weight Kg | Height cm | |
Individual TEM (intra) | Good | |||
| Acceptable | ||||
| Poor | ||||
| Reject | >3.3 | >0.21 | >1.0 |
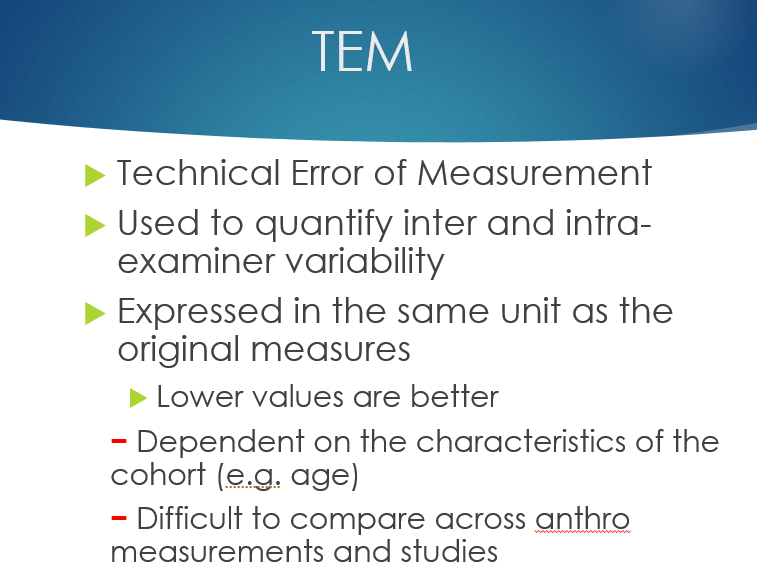
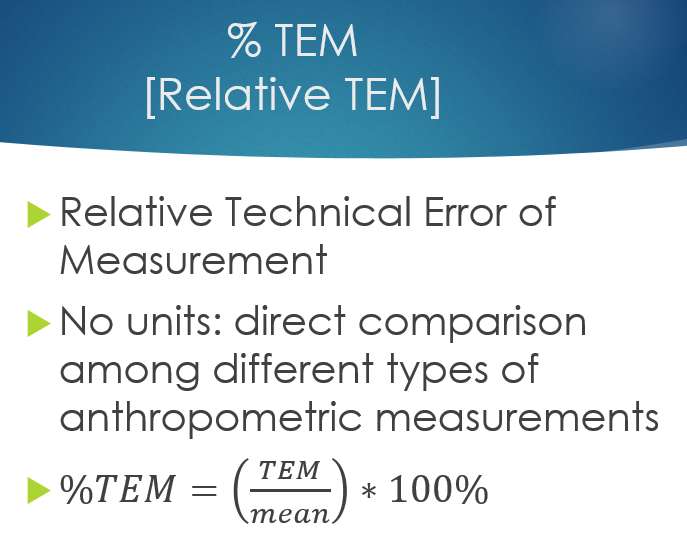
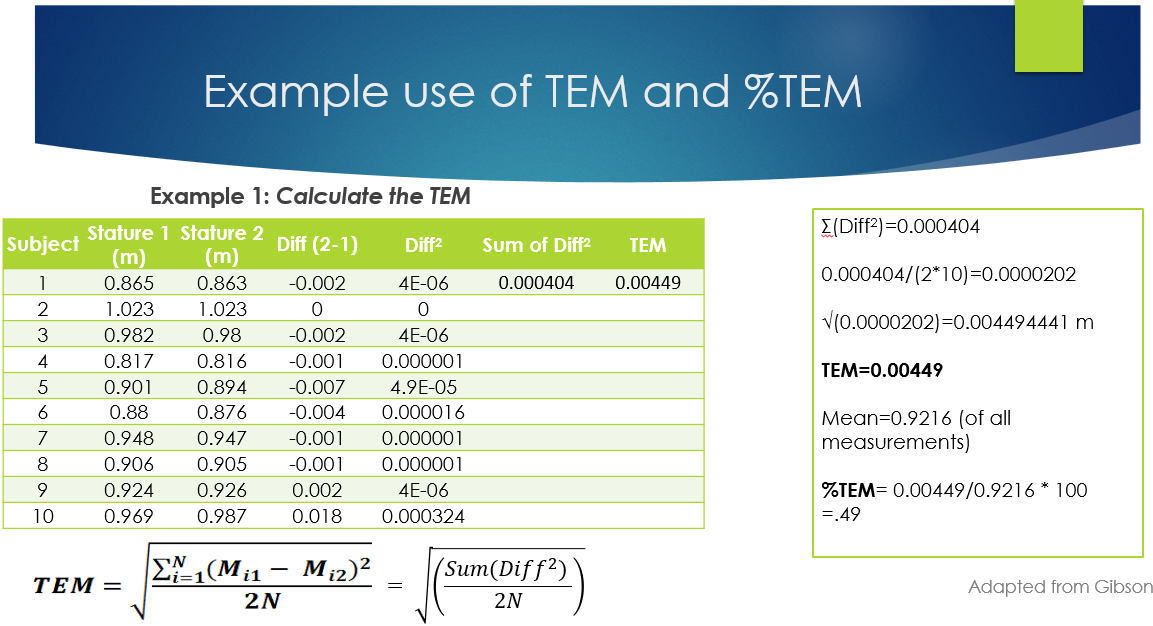
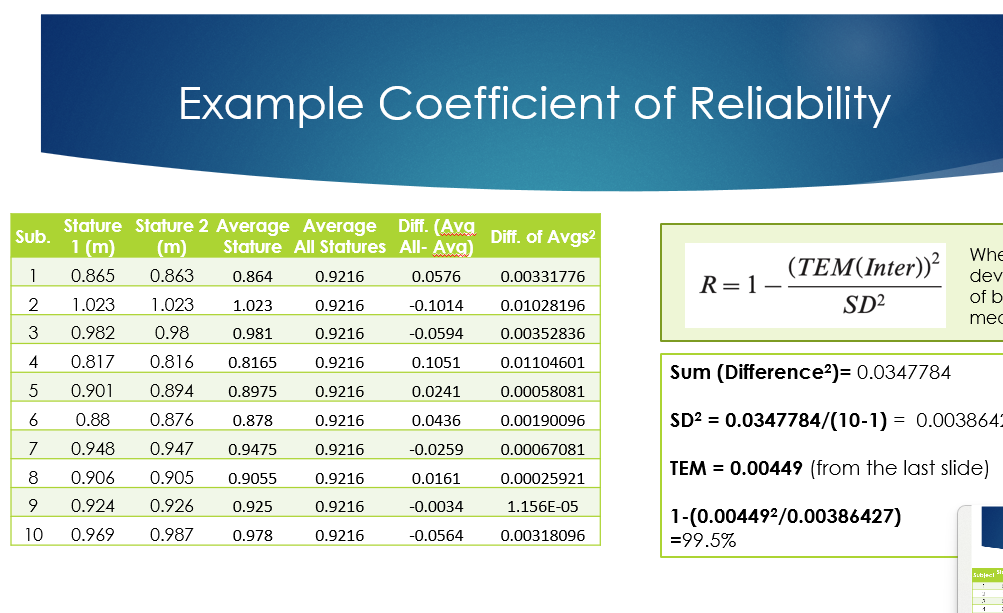
TEM Technical Error of Measurement Used fo quantify infer and intra- examiner variability Expressed in the same unit as the original measures Lower values are better - Dependent on the characteristics of the cohort (e.g. age) - Difficult to compare across anthro measurements and studies % TEM [Relative TEM] Relative Technical Error of Measurement No units: direct comparison among different types of anthropometric measurements TEM %TEM = * 100% meanExample use of TEM and %TEM Example 1: Calculate the TEM Subject Stature 1 Stature 2 (m) (m) Diff (2-1) [(Diff2)=0.000404 Diff2 Sum of Diff TEM - 0.865 0.863 -0.002 4E-06 0.000404 0.00449 0.000404/(2*10)=0.0000202 1.023 1.023 O 3 0.982 0.98 -0.002 4E-06 V(0.0000202)=0.004494441 m 4 0.817 0.816 -0.001 0.000001 TEM=0.00449 5 0.901 0.894 -0.007 4.9E-05 6 0.88 0.876 -0.004 0.000016 Mean=0.9216 (of all 7 0.948 0.947 -0.001 0.000001 measurements) 8 0.906 0.905 -0.001 0.000001 9 0.924 0.926 0.002 4E-06 %TEM= 0.00449/0.9216 * 100 10 0.969 0.987 0.018 0.000324 =.49 TEM = 2(Mil - Miz)2 = Sum(Diff2) 2N 2N Adapted from GibsonExample Coefficient of Reliability Sub. Stature Stature 2 Average Average Diff. (Ava 1 (m) (m Stature All Statures All- Ava Diff. of Avgs2 Whe 1 0.865 0.863 0.864 0.9216 0.0576 0.00331776 (TEM(Inter)) R = 1 - dev 2 1.023 1.023 1.023 0.9216 -0.1014 0.01028196 SD2 of b me 3 0.982 0.98 0.981 0.9216 -0.0594 0.00352836 4 0.817 0.816 0.8165 0.9216 0.1051 0.01104601 Sum (Difference2)= 0.0347784 5 0.901 0.894 0.8975 0.9216 0.0241 0.00058081 6 0.88 0.876 0.878 0.9216 0.0436 0.00190096 SD2 = 0.0347784/(10-1) = 0.003864 7 0.948 0.947 0.9475 0.9216 -0.0259 0.00067081 8 0.906 0.905 0.9055 0.9216 0.0161 0.00025921 TEM = 0.00449 (from the last slide) 9 0.924 0.926 0.925 0.9216 -0.0034 1.156E-05 1-(0.004492/0.00386427) 10 0.969 0.987 0.978 0.9216 -0.0564 0.00318096 =99.5%
Step by Step Solution
There are 3 Steps involved in it

Get step-by-step solutions from verified subject matter experts