

Question: Instructions: Consider the below data which is based on a company's sales in Year 1 through Year 12 along with the national income of the
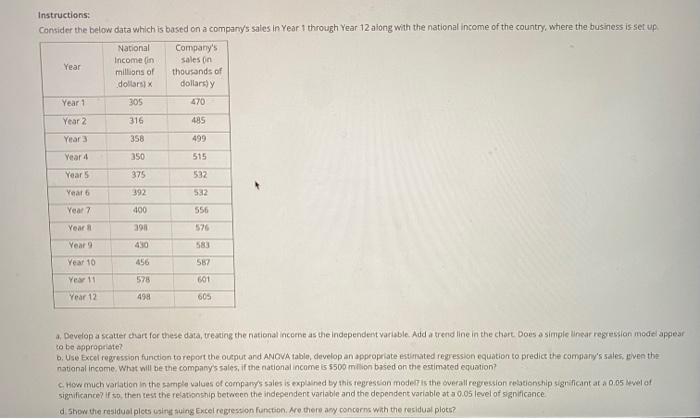
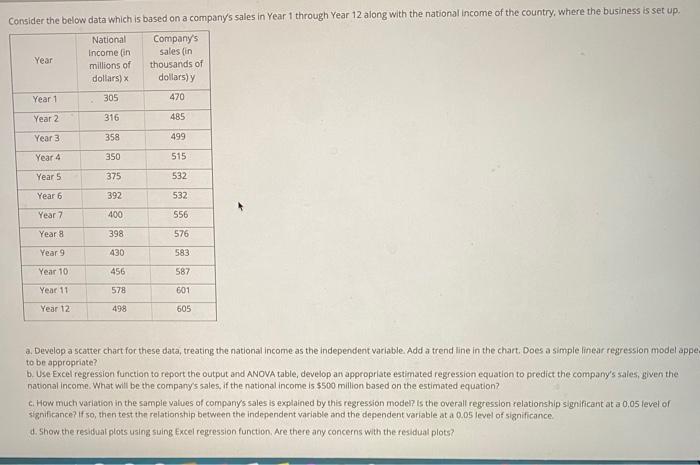
Instructions: Consider the below data which is based on a company's sales in Year 1 through Year 12 along with the national income of the country, where the business is set up National Company's Income in sales on Year millions of thousands of dollars) dollars) Year 1 305 470 Year 2 316 485 Year 358 499 Year 4 350 515 Years 375 532 Year 392 532 Year 7 400 556 Year 390 576 430 583 Year 9 Year 10 456 52 Year 18 578 601 Year 12 498 605 a. Develop a scatter chart for these data, treating the national income as the independent variable. Add a trend line in the chart Dois a simple linear regression model appear co be appropriate 6. Uso Excel regression function to report the output and ANOVA table develop an appropriate estimated regression equation to predict the company's sales, even the national income. What will be the company's sales, if the national income is $500 million based on the estimated equation? How much variation in the sample values of company's sales is explained by this regression model is the overall regression relationship significant at a 0.05 level of significance? If so, then test the relationship between the independent variable and the dependent variable at a 0.05 level of significance d show the residual plots usinuing Excel regression function. No there any concerns with the residual plots? Consider the below data which is based on a company's sales in Year 1 through Year 12 along with the national income of the country, where the business is set up National Company's Income in sales in Year millions of thousands of dollars) dollars) y Year 1 305 470 Year 2 316 485 Year 3 358 499 350 515 Year 4 Year 5 375 532 Year 6 392 532 Year 7 400 556 Year 8 398 576 Year 9 430 583 Year 10 456 587 Year 11 578 601 Year 12 498 605 a. Develop a scatter chart for these data, treating the national income as the independent variable. Add a trendline in the chart. Does a simple linear regression model appe to be appropriate? b. Use Excel regression function to report the output and ANOVA table, develop an appropriate estimated regression equation to predict the company's sales, given the national Income. What will be the company's sales, if the national income is $500 million based on the estimated equation? C. How much variation in the sample values of companys sales is explained by this regression model is the overall regression relationship significant at a 0,05 level of significance? If so, then test the relationship between the independent variable and the dependent variable at a 0.05 level of significance. d. Show the residual plots using suing Excel regression function. Are there any concerns with the residual plots
Step by Step Solution
There are 3 Steps involved in it

Get step-by-step solutions from verified subject matter experts