Question: Instructions: Create a Level O Business Process Diagram (BPD) in draw.io. An example and grading criteria are shown below. Create your own - do not
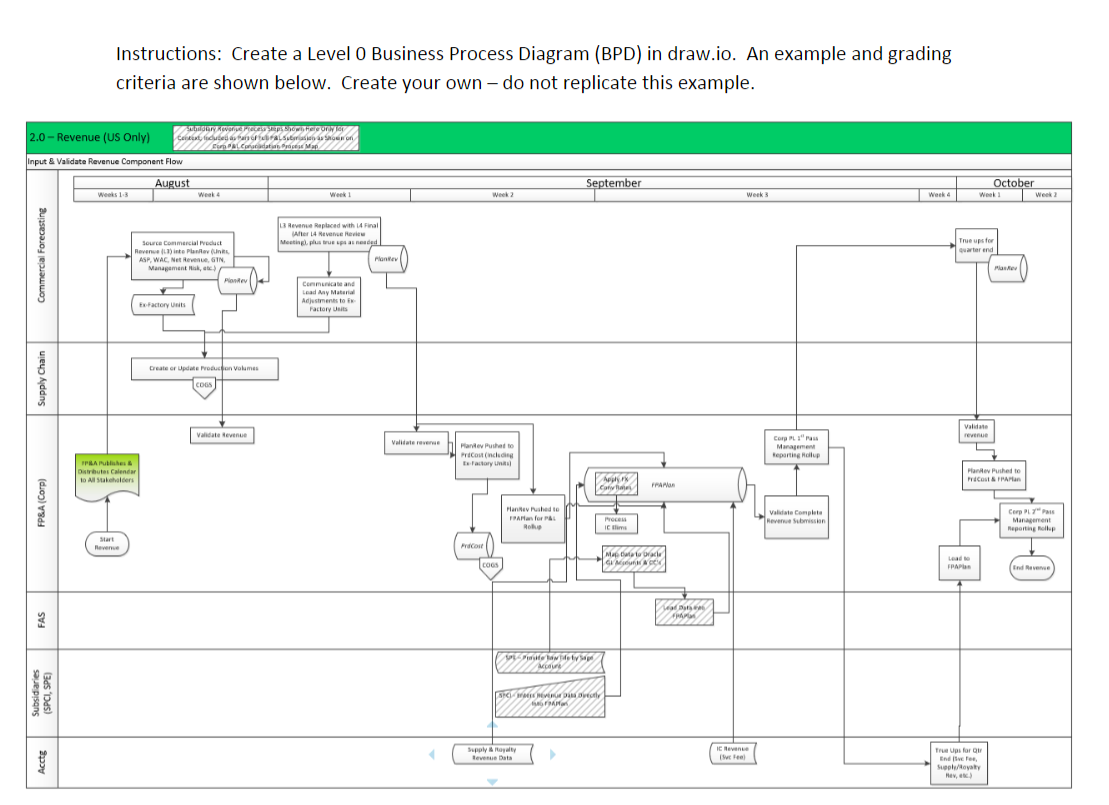
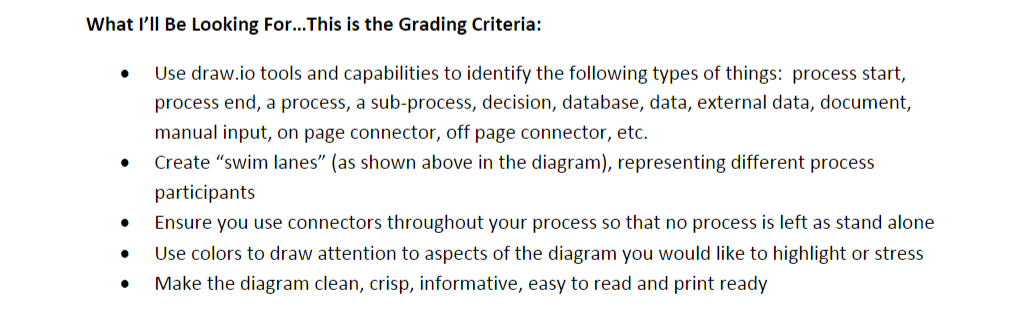
Instructions: Create a Level O Business Process Diagram (BPD) in draw.io. An example and grading criteria are shown below. Create your own - do not replicate this example. dere Preces se powi. Feleon Cents, toutes nosaltres Shoek on EL Cortadatan Press Map Input & Validate Revenue Component Flow 2.0 - Revenue (US Only) - August September October Week Week 2 Weeks 13 Week 4 Week 1 Week 2 Weeks Week True up for water end Commercial Forecasting 3 Revenue Replaced with 14 Final After 14 Nav Review Meeting, plus true ps as need Plantes Source Commercial Pack Revenue 1) into Plano un ASP, WAC, NGIN Management, Pone Communica and Leady Material Adjustments to Factory Units to Factory Dreate or Update Profon Volumes Supply Chain COS Vandate Revente Validaterovere Hande Puth Pracownia Factory Corpu" Management Reporting op PLA Publike Distributes Calendar 10 Allers APK Caves ricost & FRAM FANAR FP&A (Corp) Hand Pushte FRA for Roth Pro POEM Ime Vale Completa Reversin Cars Management Reporting Rollup Start Revenue Frost Malowa GIM COGS FPAPER Indvenue Sad F FAS det M Se prison BW SPI VERURBE Supply royalty tevens Data I feel Acctg True us for Endere Sulta Hev) What I'll Be Looking For... This is the Grading Criteria: . Use draw.io tools and capabilities to identify the following types of things: process start, process end, a process, a sub-process, decision, database, data, external data, document, manual input, on page connector, off page connector, etc. Create "swim lanes" (as shown above in the diagram), representing different process participants Ensure you use connectors throughout your process so that no process is left as stand alone Use colors to draw attention to aspects of the diagram you would like to highlight or stress Make the diagram clean, crisp, informative, easy to read and print ready . . . Instructions: Create a Level O Business Process Diagram (BPD) in draw.io. An example and grading criteria are shown below. Create your own - do not replicate this example. dere Preces se powi. Feleon Cents, toutes nosaltres Shoek on EL Cortadatan Press Map Input & Validate Revenue Component Flow 2.0 - Revenue (US Only) - August September October Week Week 2 Weeks 13 Week 4 Week 1 Week 2 Weeks Week True up for water end Commercial Forecasting 3 Revenue Replaced with 14 Final After 14 Nav Review Meeting, plus true ps as need Plantes Source Commercial Pack Revenue 1) into Plano un ASP, WAC, NGIN Management, Pone Communica and Leady Material Adjustments to Factory Units to Factory Dreate or Update Profon Volumes Supply Chain COS Vandate Revente Validaterovere Hande Puth Pracownia Factory Corpu" Management Reporting op PLA Publike Distributes Calendar 10 Allers APK Caves ricost & FRAM FANAR FP&A (Corp) Hand Pushte FRA for Roth Pro POEM Ime Vale Completa Reversin Cars Management Reporting Rollup Start Revenue Frost Malowa GIM COGS FPAPER Indvenue Sad F FAS det M Se prison BW SPI VERURBE Supply royalty tevens Data I feel Acctg True us for Endere Sulta Hev) What I'll Be Looking For... This is the Grading Criteria: . Use draw.io tools and capabilities to identify the following types of things: process start, process end, a process, a sub-process, decision, database, data, external data, document, manual input, on page connector, off page connector, etc. Create "swim lanes" (as shown above in the diagram), representing different process participants Ensure you use connectors throughout your process so that no process is left as stand alone Use colors to draw attention to aspects of the diagram you would like to highlight or stress Make the diagram clean, crisp, informative, easy to read and print ready


