

Question: Instructions: Each student should solve the homework by himself, no groups are allowed. No late homework will be accepted. Organize your solutions in a neat
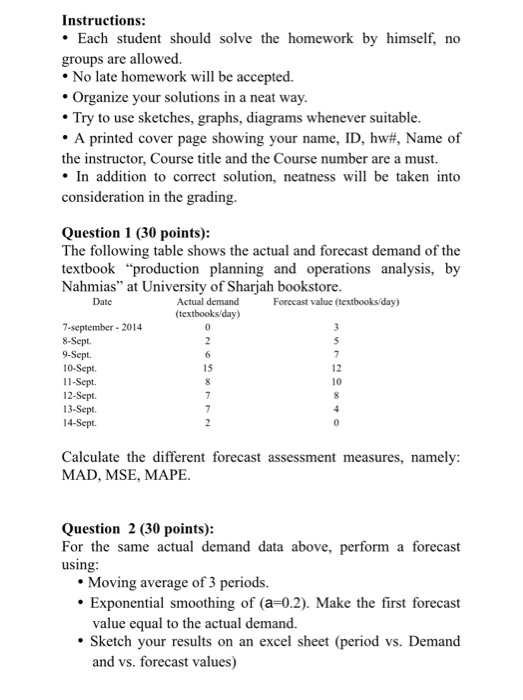
Instructions: Each student should solve the homework by himself, no groups are allowed. No late homework will be accepted. Organize your solutions in a neat way. Try to use sketches, graphs, diagrams whenever suitable. A printed cover page showing your name, ID, hw#, Name of the instructor, Course title and the Course number are a must. In addition to correct solution, neatness will be taken into consideration in the grading. Date Question 1 (30 points): The following table shows the actual and forecast demand of the textbook "production planning and operations analysis, by Nahmias at University of Sharjah bookstore. Actual demand Forecast value (textbooks/day) (textbooks/day) 7-september - 2014 8-Sept. 9-Sept. 10-Sept. 11-Sept. 12-Sept. 7 13-Sept 7 0 2 6 15 8 5 7 12 10 14-Sept. Calculate the different forecast assessment measures, namely: MAD, MSE, MAPE. Question 2 (30 points): For the same actual demand data above, perform a forecast using: Moving average of 3 periods. Exponential smoothing of (a=0.2). Make the first forecast value equal to the actual demand. Sketch your results on an excel sheet (period vs. Demand and vs. forecast values)
Step by Step Solution
There are 3 Steps involved in it

Get step-by-step solutions from verified subject matter experts