

Question: Instructions for Example Data Install the Data Analysis toolpak if you do not already have it . This is an easy step that requires you
Instructions for Example Data
Install the Data Analysis toolpak if you do not already have it This is an easy step that requires you to go to options Addins and select the Analysis toolpak to install.
Once installed, you should be able to go the Data tab at the top of Excel and see a button for Data Analysis at the edge of the menu. This is where you will specify the regression.
We first have to get the data in order. You need to average the two SelfAwareness Items. Make a new column that includes that average.
tableLeadership Rating,Extraversion,Self Awareness QSelf Awareness QAverage Self
In order to conduct a multiple regression, the data must be formatting into a matrix that includes ONLY the Y and X variables. Our example data is not in this format currently. Copy and paste the Leadership Rating, Extraversion, and Average SelfAwareness columns so that they are all beside each other.
tableLeadership Rating,Extraversion,Average Self
Now we are ready to click on the Data Analysis Button. Do that. You will have many options for different statistical tests. Scroll down and select regression.
Once you select regression, you are asked for the variables. In this case, Leadership Ratings are our dependent variable or our Y Select the Leadership Ratings column for the Y variable. Next, you must select your independent variables or X Use your mouse to select both Extraversion and Average Self to be in the column. This is all that you need to specify.
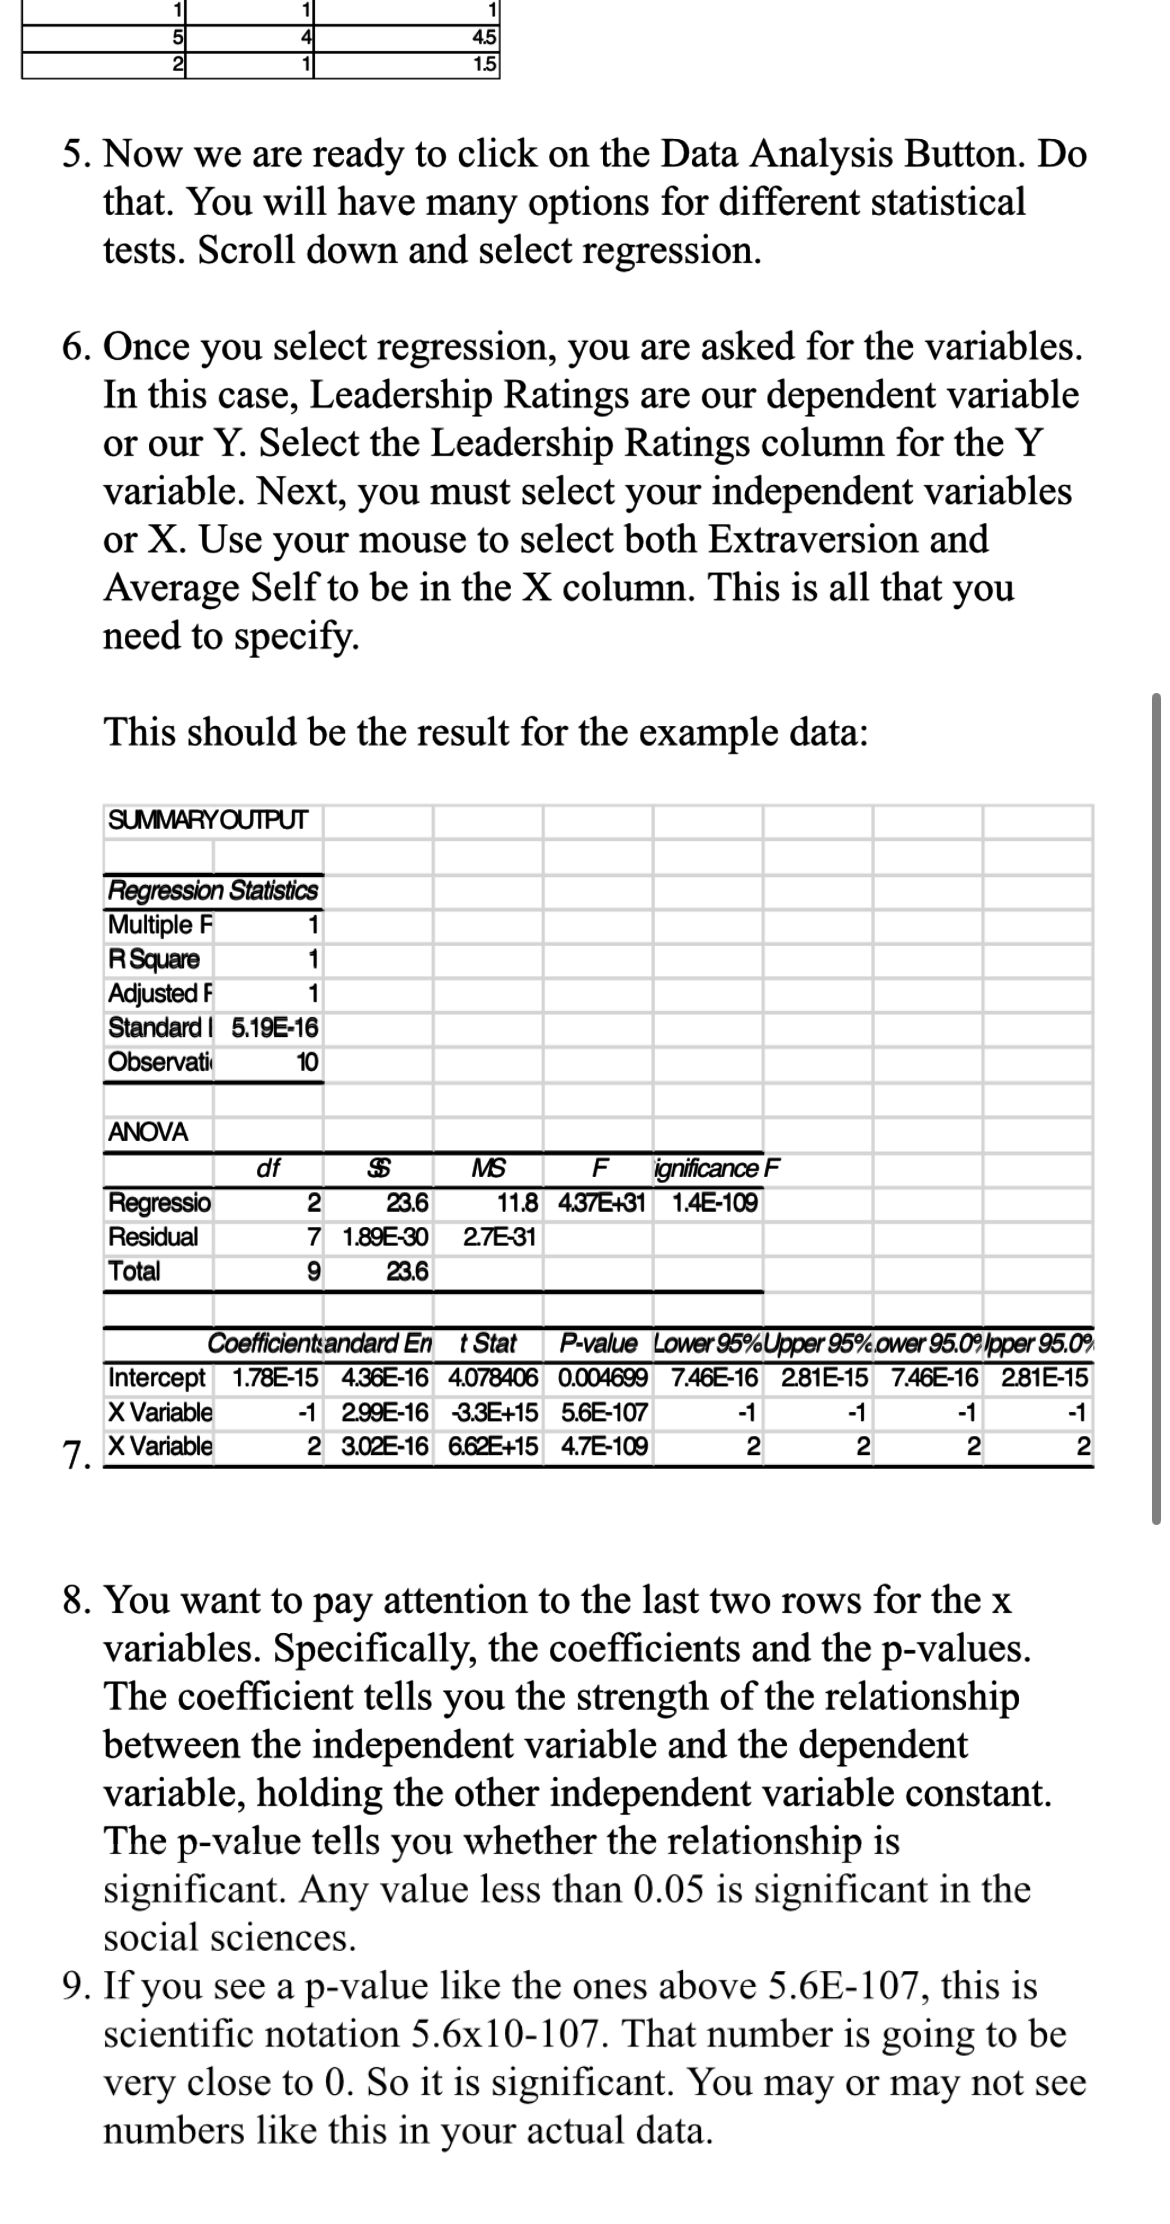
This should be the result for the example data:
SUMMARYOUIPUT
table
Now we are ready to click on the Data Analysis Button. Do that. You will have many options for different statistical tests. Scroll down and select regression.
Once you select regression, you are asked for the variables. In this case, Leadership Ratings are our dependent variable or our Y Select the Leadership Ratings column for the Y variable. Next, you must select your independent variables or X Use your mouse to select both Extraversion and Average Self to be in the X column. This is all that you need to specify.
This should be the result for the example data:
tableSUMMARYOUTPUTRegression Statistics Multiple RSquareAdjusted FStandard I EObservatiANOVAignificance RegressioResidualETotal Coefficientse andard tStat,value,Lower LUpper ower Ipper :InterceptEEEEEX Variable,EE Variable,E
You want to pay attention to the last two rows for the variables. Specifically, the coefficients and the pvalues. The coefficient tells you the strength of the relationship between the independent variable and the dependent variable, holding the other independent variable constant. The value tells you whether the relationship is significant. Any value less than is significant in the social sciences.
If you see a pvalue like the ones above E this is scientific notation That number is going to be very close to So it is significant. You may or may not see numbers like this in your actual data.
Step by Step Solution
There are 3 Steps involved in it
1 Expert Approved Answer
Step: 1 Unlock

Question Has Been Solved by an Expert!
Get step-by-step solutions from verified subject matter experts
Step: 2 Unlock
Step: 3 Unlock