

Question: Instructions - Include at least two decimal places in all answers. - Must show calculation steps to recelve full credit. You can either type calculation
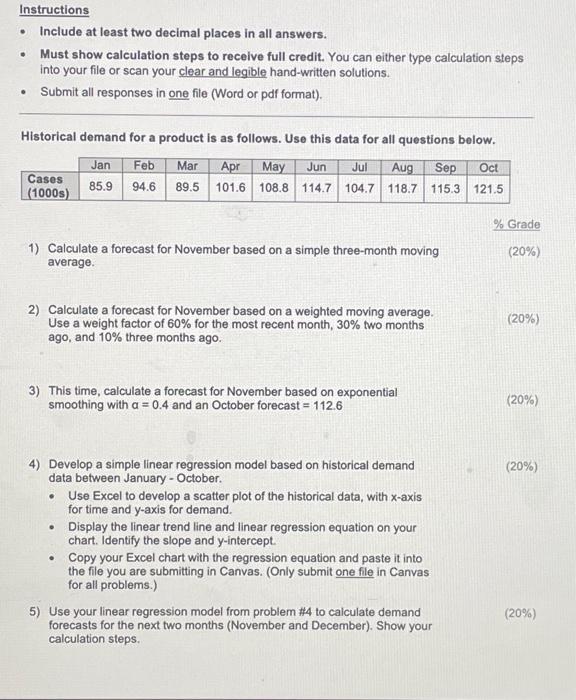
Instructions - Include at least two decimal places in all answers. - Must show calculation steps to recelve full credit. You can either type calculation steps into your file or scan your clear and legible hand-written solutions. - Submit all responses in one file (Word or pdf format). Historical demand for a product is as follows. Use this data for all questions below. % Grade 1) Calculate a forecast for November based on a simple three-month moving average. (20%) 2) Calculate a forecast for November based on a weighted moving average. Use a weight factor of 60% for the most recent month, 30% two months (20%) ago, and 10% three months ago. 3) This time, calculate a forecast for November based on exponential smoothing with a=0.4 and an October forecast =112.6 (20%) 4) Develop a simple linear regression model based on historical demand data between January - October. (20%) - Use Excel to develop a scatter plot of the historical data, with x-axis for time and y-axis for demand. - Display the linear trend line and linear regression equation on your chart. Identify the slope and y-intercept. - Copy your Excel chart with the regression equation and paste it into the file you are submitting in Canvas. (Only submit one file in Canvas for all problems.) 5) Use your linear regression model from problem \#4 to calculate demand (20\%)
Step by Step Solution
There are 3 Steps involved in it

Get step-by-step solutions from verified subject matter experts