

On the Excel Financial Forecast worksheet fill in the information highlighted in red with data from...
Fantastic news! We've Found the answer you've been seeking!
Question:
Transcribed Image Text:
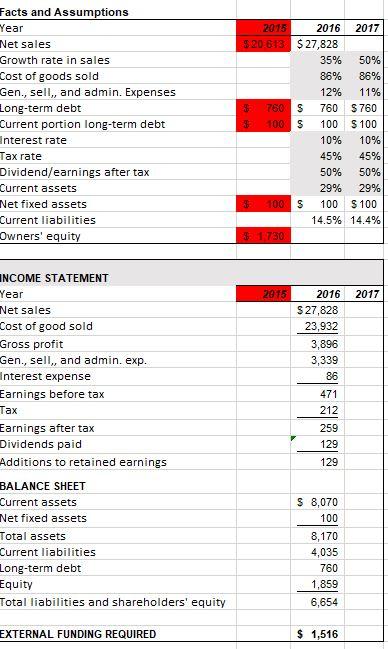
On the Excel Financial Forecast worksheet fill in the information highlighted in red with data from your company. • Repeat the formulas in column C row 18-37 in column D. Doing this should allow you to adjust values in the fact and Assumptions part of column D and see its affect in row 18-27 of the same column. https://www.youtube.com/watch?v=dOGYMLC8bZs Using the Excel Financial Forecast worksheet, determine the 'sensitivity of the model by adjusting the values of growth rate in sales and cost of goods sold in column D. Increase and decreases the % values for 2017 and observe and record the results. Create an Excel chart for each (growth rate in sales and cost of goods sold) the resulting impact on external funding required. • Explain your observations on: How did adjusting growth rate of sale and cost of good sold affect the income statement and balance sheet? o What is External Funding Required and how was it affected by adjusting sales projections and cost of goods sold? Requirements: • All questions posed must be addressed completely. • Length: two-page Executive Summary • Include the two charts. • All sources used must be properly cited in APA format. • Forecast model must be included with the word document. Be sure to read the criteria, by which your assignment will be evaluated, before you write, and again after you write. Facts and Assumptions Year Net sales Growth rate in sales Cost of goods sold Gen., sell,, and admin. Expenses Long-term debt Current portion long-term debt Interest rate Tax rate Dividend/earnings after tax Current assets Net fixed assets Current liabilities Owners' equity INCOME STATEMENT Year Net sales Cost of good sold Gross profit Gen., sell,, and admin. exp. Interest expense Earnings before tax Tax Earnings after tax Dividends paid Additions to retained earnings BALANCE SHEET Current assets Net fixed assets Total assets Current liabilities Long-term debt Equity Total liabilities and shareholders' equity EXTERNAL FUNDING REQUIRED 2015 $20.613 $27,828 $ 760 $ $ 100 $ $ 100 $ $1,730 2016 2017 2015 35% 50% 86% 86% 12% 11% 760 $760 100 $100 10% 10% 45% 45% 50% 50% 29% 29% 100 $100 14.5% 14.4% 2016 2017 $27,828 23,932 3,896 3,339 86 471 212 259 129 129 $ 8,070 100 8,170 4,035 760 1,859 6,654 $ 1,516 On the Excel Financial Forecast worksheet fill in the information highlighted in red with data from your company. • Repeat the formulas in column C row 18-37 in column D. Doing this should allow you to adjust values in the fact and Assumptions part of column D and see its affect in row 18-27 of the same column. https://www.youtube.com/watch?v=dOGYMLC8bZs Using the Excel Financial Forecast worksheet, determine the 'sensitivity of the model by adjusting the values of growth rate in sales and cost of goods sold in column D. Increase and decreases the % values for 2017 and observe and record the results. Create an Excel chart for each (growth rate in sales and cost of goods sold) the resulting impact on external funding required. • Explain your observations on: How did adjusting growth rate of sale and cost of good sold affect the income statement and balance sheet? o What is External Funding Required and how was it affected by adjusting sales projections and cost of goods sold? Requirements: • All questions posed must be addressed completely. • Length: two-page Executive Summary • Include the two charts. • All sources used must be properly cited in APA format. • Forecast model must be included with the word document. Be sure to read the criteria, by which your assignment will be evaluated, before you write, and again after you write. Facts and Assumptions Year Net sales Growth rate in sales Cost of goods sold Gen., sell,, and admin. Expenses Long-term debt Current portion long-term debt Interest rate Tax rate Dividend/earnings after tax Current assets Net fixed assets Current liabilities Owners' equity INCOME STATEMENT Year Net sales Cost of good sold Gross profit Gen., sell,, and admin. exp. Interest expense Earnings before tax Tax Earnings after tax Dividends paid Additions to retained earnings BALANCE SHEET Current assets Net fixed assets Total assets Current liabilities Long-term debt Equity Total liabilities and shareholders' equity EXTERNAL FUNDING REQUIRED 2015 $20.613 $27,828 $ 760 $ $ 100 $ $ 100 $ $1,730 2016 2017 2015 35% 50% 86% 86% 12% 11% 760 $760 100 $100 10% 10% 45% 45% 50% 50% 29% 29% 100 $100 14.5% 14.4% 2016 2017 $27,828 23,932 3,896 3,339 86 471 212 259 129 129 $ 8,070 100 8,170 4,035 760 1,859 6,654 $ 1,516 On the Excel Financial Forecast worksheet fill in the information highlighted in red with data from your company. • Repeat the formulas in column C row 18-37 in column D. Doing this should allow you to adjust values in the fact and Assumptions part of column D and see its affect in row 18-27 of the same column. https://www.youtube.com/watch?v=dOGYMLC8bZs Using the Excel Financial Forecast worksheet, determine the 'sensitivity of the model by adjusting the values of growth rate in sales and cost of goods sold in column D. Increase and decreases the % values for 2017 and observe and record the results. Create an Excel chart for each (growth rate in sales and cost of goods sold) the resulting impact on external funding required. • Explain your observations on: How did adjusting growth rate of sale and cost of good sold affect the income statement and balance sheet? o What is External Funding Required and how was it affected by adjusting sales projections and cost of goods sold? Requirements: • All questions posed must be addressed completely. • Length: two-page Executive Summary • Include the two charts. • All sources used must be properly cited in APA format. • Forecast model must be included with the word document. Be sure to read the criteria, by which your assignment will be evaluated, before you write, and again after you write. Facts and Assumptions Year Net sales Growth rate in sales Cost of goods sold Gen., sell,, and admin. Expenses Long-term debt Current portion long-term debt Interest rate Tax rate Dividend/earnings after tax Current assets Net fixed assets Current liabilities Owners' equity INCOME STATEMENT Year Net sales Cost of good sold Gross profit Gen., sell,, and admin. exp. Interest expense Earnings before tax Tax Earnings after tax Dividends paid Additions to retained earnings BALANCE SHEET Current assets Net fixed assets Total assets Current liabilities Long-term debt Equity Total liabilities and shareholders' equity EXTERNAL FUNDING REQUIRED 2015 $20.613 $27,828 $ 760 $ $ 100 $ $ 100 $ $1,730 2016 2017 2015 35% 50% 86% 86% 12% 11% 760 $760 100 $100 10% 10% 45% 45% 50% 50% 29% 29% 100 $100 14.5% 14.4% 2016 2017 $27,828 23,932 3,896 3,339 86 471 212 259 129 129 $ 8,070 100 8,170 4,035 760 1,859 6,654 $ 1,516 On the Excel Financial Forecast worksheet fill in the information highlighted in red with data from your company. • Repeat the formulas in column C row 18-37 in column D. Doing this should allow you to adjust values in the fact and Assumptions part of column D and see its affect in row 18-27 of the same column. https://www.youtube.com/watch?v=dOGYMLC8bZs Using the Excel Financial Forecast worksheet, determine the 'sensitivity of the model by adjusting the values of growth rate in sales and cost of goods sold in column D. Increase and decreases the % values for 2017 and observe and record the results. Create an Excel chart for each (growth rate in sales and cost of goods sold) the resulting impact on external funding required. • Explain your observations on: How did adjusting growth rate of sale and cost of good sold affect the income statement and balance sheet? o What is External Funding Required and how was it affected by adjusting sales projections and cost of goods sold? Requirements: • All questions posed must be addressed completely. • Length: two-page Executive Summary • Include the two charts. • All sources used must be properly cited in APA format. • Forecast model must be included with the word document. Be sure to read the criteria, by which your assignment will be evaluated, before you write, and again after you write. Facts and Assumptions Year Net sales Growth rate in sales Cost of goods sold Gen., sell,, and admin. Expenses Long-term debt Current portion long-term debt Interest rate Tax rate Dividend/earnings after tax Current assets Net fixed assets Current liabilities Owners' equity INCOME STATEMENT Year Net sales Cost of good sold Gross profit Gen., sell,, and admin. exp. Interest expense Earnings before tax Tax Earnings after tax Dividends paid Additions to retained earnings BALANCE SHEET Current assets Net fixed assets Total assets Current liabilities Long-term debt Equity Total liabilities and shareholders' equity EXTERNAL FUNDING REQUIRED 2015 $20.613 $27,828 $ 760 $ $ 100 $ $ 100 $ $1,730 2016 2017 2015 35% 50% 86% 86% 12% 11% 760 $760 100 $100 10% 10% 45% 45% 50% 50% 29% 29% 100 $100 14.5% 14.4% 2016 2017 $27,828 23,932 3,896 3,339 86 471 212 259 129 129 $ 8,070 100 8,170 4,035 760 1,859 6,654 $ 1,516 On the Excel Financial Forecast worksheet fill in the information highlighted in red with data from your company. • Repeat the formulas in column C row 18-37 in column D. Doing this should allow you to adjust values in the fact and Assumptions part of column D and see its affect in row 18-27 of the same column. https://www.youtube.com/watch?v=dOGYMLC8bZs Using the Excel Financial Forecast worksheet, determine the 'sensitivity of the model by adjusting the values of growth rate in sales and cost of goods sold in column D. Increase and decreases the % values for 2017 and observe and record the results. Create an Excel chart for each (growth rate in sales and cost of goods sold) the resulting impact on external funding required. • Explain your observations on: How did adjusting growth rate of sale and cost of good sold affect the income statement and balance sheet? o What is External Funding Required and how was it affected by adjusting sales projections and cost of goods sold? Requirements: • All questions posed must be addressed completely. • Length: two-page Executive Summary • Include the two charts. • All sources used must be properly cited in APA format. • Forecast model must be included with the word document. Be sure to read the criteria, by which your assignment will be evaluated, before you write, and again after you write. Facts and Assumptions Year Net sales Growth rate in sales Cost of goods sold Gen., sell,, and admin. Expenses Long-term debt Current portion long-term debt Interest rate Tax rate Dividend/earnings after tax Current assets Net fixed assets Current liabilities Owners' equity INCOME STATEMENT Year Net sales Cost of good sold Gross profit Gen., sell,, and admin. exp. Interest expense Earnings before tax Tax Earnings after tax Dividends paid Additions to retained earnings BALANCE SHEET Current assets Net fixed assets Total assets Current liabilities Long-term debt Equity Total liabilities and shareholders' equity EXTERNAL FUNDING REQUIRED 2015 $20.613 $27,828 $ 760 $ $ 100 $ $ 100 $ $1,730 2016 2017 2015 35% 50% 86% 86% 12% 11% 760 $760 100 $100 10% 10% 45% 45% 50% 50% 29% 29% 100 $100 14.5% 14.4% 2016 2017 $27,828 23,932 3,896 3,339 86 471 212 259 129 129 $ 8,070 100 8,170 4,035 760 1,859 6,654 $ 1,516 On the Excel Financial Forecast worksheet fill in the information highlighted in red with data from your company. • Repeat the formulas in column C row 18-37 in column D. Doing this should allow you to adjust values in the fact and Assumptions part of column D and see its affect in row 18-27 of the same column. https://www.youtube.com/watch?v=dOGYMLC8bZs Using the Excel Financial Forecast worksheet, determine the 'sensitivity of the model by adjusting the values of growth rate in sales and cost of goods sold in column D. Increase and decreases the % values for 2017 and observe and record the results. Create an Excel chart for each (growth rate in sales and cost of goods sold) the resulting impact on external funding required. • Explain your observations on: How did adjusting growth rate of sale and cost of good sold affect the income statement and balance sheet? o What is External Funding Required and how was it affected by adjusting sales projections and cost of goods sold? Requirements: • All questions posed must be addressed completely. • Length: two-page Executive Summary • Include the two charts. • All sources used must be properly cited in APA format. • Forecast model must be included with the word document. Be sure to read the criteria, by which your assignment will be evaluated, before you write, and again after you write. Facts and Assumptions Year Net sales Growth rate in sales Cost of goods sold Gen., sell,, and admin. Expenses Long-term debt Current portion long-term debt Interest rate Tax rate Dividend/earnings after tax Current assets Net fixed assets Current liabilities Owners' equity INCOME STATEMENT Year Net sales Cost of good sold Gross profit Gen., sell,, and admin. exp. Interest expense Earnings before tax Tax Earnings after tax Dividends paid Additions to retained earnings BALANCE SHEET Current assets Net fixed assets Total assets Current liabilities Long-term debt Equity Total liabilities and shareholders' equity EXTERNAL FUNDING REQUIRED 2015 $20.613 $27,828 $ 760 $ $ 100 $ $ 100 $ $1,730 2016 2017 2015 35% 50% 86% 86% 12% 11% 760 $760 100 $100 10% 10% 45% 45% 50% 50% 29% 29% 100 $100 14.5% 14.4% 2016 2017 $27,828 23,932 3,896 3,339 86 471 212 259 129 129 $ 8,070 100 8,170 4,035 760 1,859 6,654 $ 1,516
Expert Answer:
Answer rating: 100% (QA)
Here are my observations on how adjusting the growth rate of sales and cost of goods sold affected t... View the full answer

Related Book For 

Income Tax Fundamentals 2013
ISBN: 9781285586618
31st Edition
Authors: Gerald E. Whittenburg, Martha Altus Buller, Steven L Gill
Posted Date:
Students also viewed these accounting questions
-
The following income statement and balance sheet information are available for two firms, Firm A and Firm B. (a) Calculate the amount of dividends Firm A and Firm B paid using the information given....
-
An incomplete comparative income statement and balance sheet for Amherst Corporation follow: Requirement 1. Using the ratios, common-size percentages, and trend percentages given, complete the income...
-
An incomplete comparative income statement and balance sheet for Emore Corporation follow: Requirment 1. Using the ratios, common-size percentages, and trend percentages given, complete the...
-
Use the present value tables in Appendix A and Appendix B to compute the NPV of each of the following cash inflows. a. $89,000 received at the end of six years. The discount rate is 4 percent. b....
-
Project risks can/cannot be eliminated if the project is carefully planned. Explain.
-
Figure 25-1 OUTPUT PER WORKER CAPITAL PER WORKER Refer to Figure 25-1. The curve becomes flatter as the amount of capital per worker increases because of
-
Records show that the probability is 0.00008 that a truck will have an accident on a certain highway. Use the formula for the Poisson distribution to approximate the probability that at least 5 of...
-
Lance Armstrong won the Tour de France seven consecutive years (1999-2005). The following table gives the winning times, distances, speeds, and margin of victory. (a) Determine the mean and median of...
-
There are several pitfalls and common misconceptions in accounting analysis that an analyst should avoid. Discuss these pitfalls and misconceptions.
-
Wayland Custom Woodworking is a firm that manufactures custom cabinets and woodwork for business and residential customers. Students will have the opportunity to establish payroll records and to...
-
Place 2 pieces of 10 cm or so long strip of tape on the table with the sticky side down, with the end of each tape curled over to make a non-stick handle. Peel each piece of tape off the table and...
-
A satellite, observed from a ground station, is found to have an altitude of 1000km and a velocity of 5.5km/sec. It is know that the satellite is at its furthest distance from the Earth. a. b. C. d....
-
Exercise 1 stiffness matrix of a simple frame. Find the stiffness matrix for the problem on the right: Consider: E = 200 GPa A = 0.2 cm /=1m y EA 2EA 1 X 31 F,u 42
-
Consider vectors u = 8i - 6j and v = 6i5j. Here you will show that v can be decomposed as a sum v = w + q where w is parallel to u and q is perpendicular to w. Enter your results using the component...
-
Problem 2: A single-piece bicycle crank is shown below under the following loading scenario: the rider is pedaling forward by applying a vertical force Fp = 500 N on the left pedal and no force on...
-
For a set of experimental data of (y, X), i=1,...n, the theoretical analysis suggests that the data should follow a basic form of y = Ax* exp B X (1) Assuming k is a pre-determined constant, how to...
-
Common shares of Benson Industries Inc. have a beta of 0.88 The market risk premium is 6.6 percent, and T-bills are currently yielding 0.21 percent. The firm paid dividends totalling $0.48 in the...
-
(a) With not more than 300 words, examine why Malaysia missed its 2020 targets to divert 40% of waste from landfills and increase recycling rates to 22%. (10 marks) b) Why arent Malaysian recycling?...
-
Calculate the amount of the child and dependent care credit allowed for 2012 in each of the following cases, assuming the taxpayers had no income other than the stated amounts. a. William and Carla...
-
Rebecca and Walter Bunge have been married for 5 years. They live at 883 Scrub Brush Street, Apt. 52B, Las Vegas, NV 89125. Rebecca is a homemaker and Walt is a high school teacher. Rebecca's Social...
-
During 2012, Palo Fiero purchases the following property for use in his manufacturing business: Palo uses the accelerated depreciation method under MACRS, if available, and does not make the election...
-
Timiri received a diamond ring from her father as a gift on December 25. Her father paid \($6,250\) for the ring three years ago and its fair market value on December 25 is \($5,000.\) Assume her...
-
Arjun died on April 3, Year 4 with a gross estate of \($11,500,000.\) In his will, he left his personal residence to his grandson. Arjun had originally purchased the home for \($172,000.\) Fair...
-
Shaquille received artwork from his grandma as a gift on January 31. Grandma purchased the artwork for \($5,000\) and its fair market value on January 31 is \($8,500.\) What is Shaquilles gain basis...

Study smarter with the SolutionInn App