

Question: Instructions: Step 1: In this activity, you will be using the given information below. The table shows the number of coronavirus COVID-19 patients in the
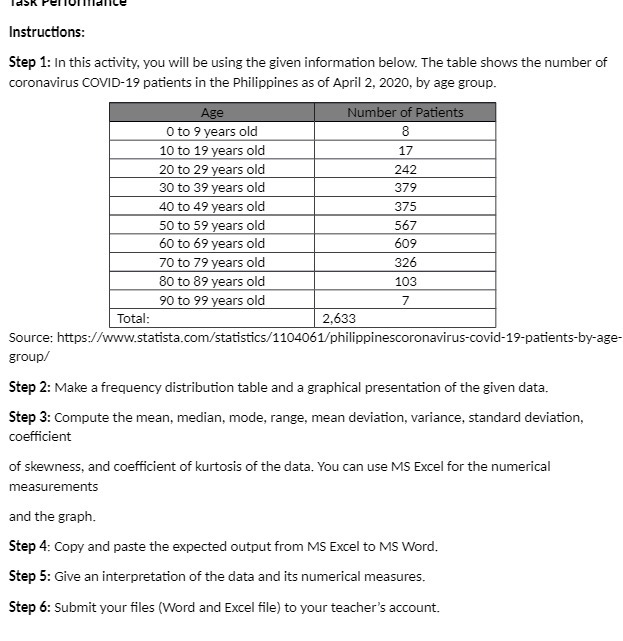
Instructions: Step 1: In this activity, you will be using the given information below. The table shows the number of coronavirus COVID-19 patients in the Philippines as of April 2, 2020, by age group. Age Number of Patients 0 to 9 years old 8 10 to 19 years old 17 20 to 29 years old 242 30 to 39 years old 379 40 to 49 years old 375 50 to 59 years old 567 60 to 69 years old 609 70 to 79 years old 326 80 to 89 years old 103 90 to 99 years old 7 Total: 2,633 Source: https://www.statista.com/statistics/1104061/philippinescoronavirus-covid-19-patients-by-age group/ Step 2: Make a frequency distribution table and a graphical presentation of the given data. Step 3: Compute the mean, median, mode, range, mean deviation, variance, standard deviation, coefficient of skewness, and coefficient of kurtosis of the data. You can use MS Excel for the numerical measurements and the graph. Step 4: Copy and paste the expected output from MS Excel to MS Word. Step 5: Give an interpretation of the data and its numerical measures. Step 6: Submit your files (Word and Excel file) to your teacher's account
Step by Step Solution
There are 3 Steps involved in it

Get step-by-step solutions from verified subject matter experts