

Question: Instructions The file Module 5 Unit 1 Review Project Template.xlsx contains a handful of data sets on separate worksheets (tabs) labeled Module 2 , Module
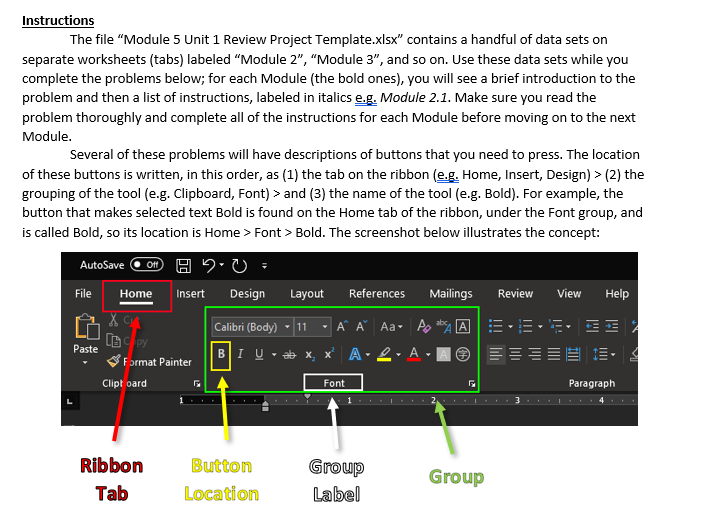
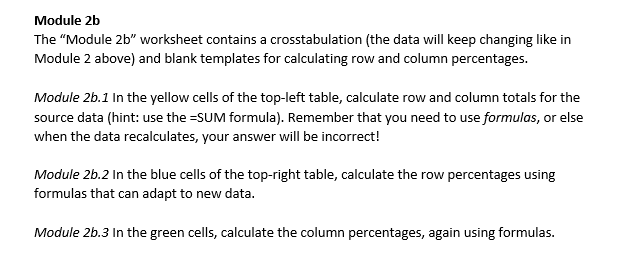
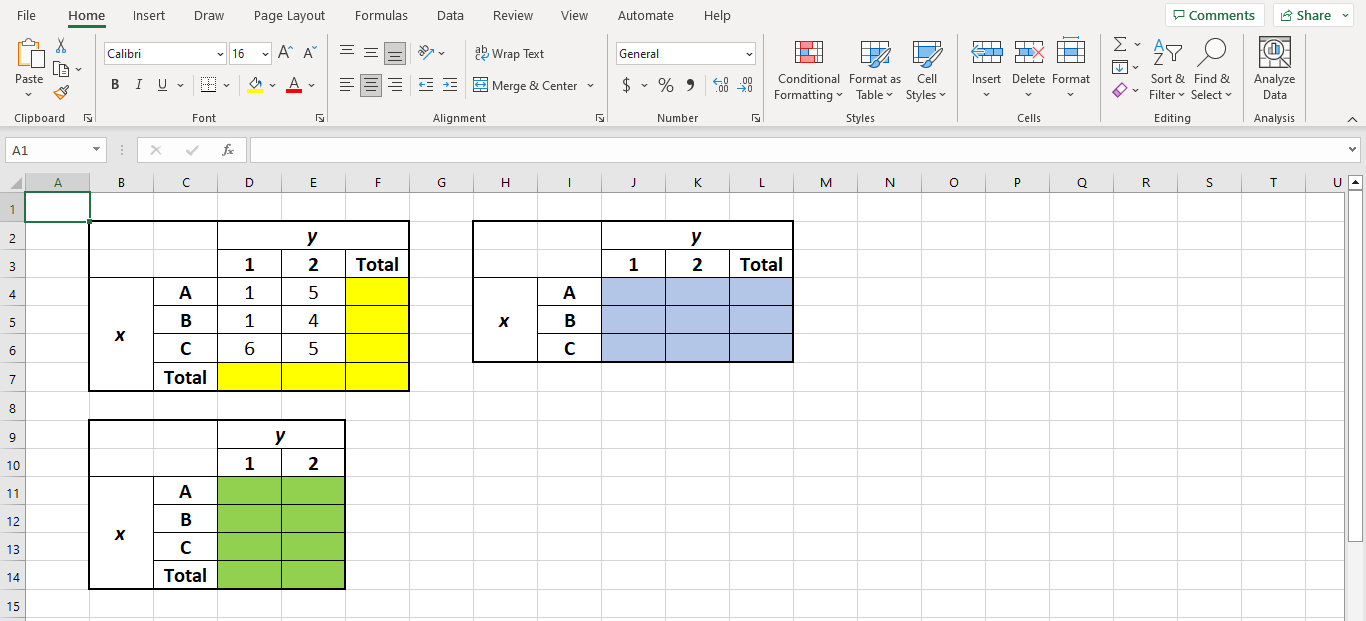
Instructions The file "Module 5 Unit 1 Review Project Template.xlsx" contains a handful of data sets on separate worksheets (tabs) labeled "Module 2 ", "Module 3 ", and so on. Use these data sets while you complete the problems below; for each Module (the bold ones), you will see a brief introduction to the problem and then a list of instructions, labeled in italics e.g. Module 2.1. Make sure you read the problem thoroughly and complete all of the instructions for each Module before moving on to the next Module. Several of these problems will have descriptions of buttons that you need to press. The location of these buttons is written, in this order, as (1) the tab on the ribbon (e.g. Home, Insert, Design) > (2) the grouping of the tool (e.g. Clipboard, Font) > and (3) the name of the tool (e.g. Bold). For example, the button that makes selected text Bold is found on the Home tab of the ribbon, under the Font group, and is called Bold, so its location is Home > Font > Bold. The screenshot below illustrates the concept: Module 2b The "Module 2b " worksheet contains a crosstabulation (the data will keep changing like in Module 2 above) and blank templates for calculating row and column percentages. Module 2b.1 In the yellow cells of the top-left table, calculate row and column totals for the source data (hint: use the =SUM formula). Remember that you need to use formulas, or else when the data recalculates, your answer will be incorrect! Module 2b.2 In the blue cells of the top-right table, calculate the row percentages using formulas that can adapt to new data. Module 2b.3 In the green cells, calculate the column percentages, again using formulas
Step by Step Solution
There are 3 Steps involved in it

Get step-by-step solutions from verified subject matter experts