

Question: Instructions This week's lab will use regression to answer the question: Can you predict clothing sales by number of catalogs mailed out to customers? Hypotheses:
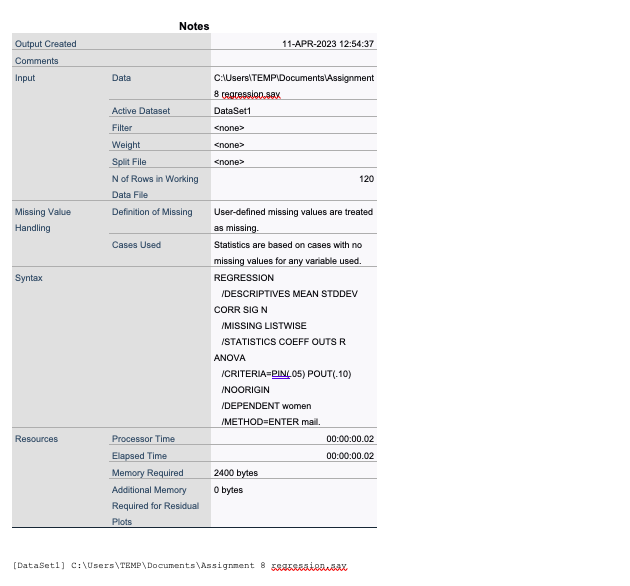
Instructions This week's lab will use regression to answer the question: Can you predict clothing sales by number of catalogs mailed out to customers? Hypotheses: In a brief paragraph, just say your impression of the question. If you had to make an educated guess, based on your own reallife experience {and previous SPSS assignments), do you think number of catalogs mailed out to customers would be a good predictor of clothing sales? Why? SPSS Analysis: We have a data set with two variables. number of catalogs mailed out to customers {continuous}, and the sales of women's clothing within that catalog (also a continuous variable}. Open the data {see Dataset Files below). Conduct a simple regression to determine the ability of number of catalogs mailed out to customers to predict women's clothing sales. Please use the SPSS Assignment 8 Lab Book to help guide you through the process of conducting the simple regression, gopyig and pasting the output to a Word document, and using the values provided to write the regression equation for these variables. Results: Identify the primary goai of this analysis. Report the coefcient of determination {rsquared}. Why is this statistic important to this output? Report the F-ratio. Why is this statistic important to this output? Report the tvalue (and E significance) for the slope. Why is this statistic important to this output? Report the regression equation. Refer to the learning guide Chapter 16: Evaluating Regression if you need help answering these questions. Conclusions: Write a brief paragraph about what your results indicate regarding clothing sales for this company. Can you trust the regression line produced from this analysis? Provide evidence to support your answer. Notes Output Created 11-APR-2023 12:54:37 Comments Input Data C:\\Users\\TEMP\\Documents\\Assignment 4 regression.sax Active Dataset DataSet1 Filter
Step by Step Solution
There are 3 Steps involved in it

Get step-by-step solutions from verified subject matter experts