

Question: Instructions to assignment For each quantitative variable, select at least one measure of central tendency and at least one measure of dispersion (Please see table
Instructions to assignment
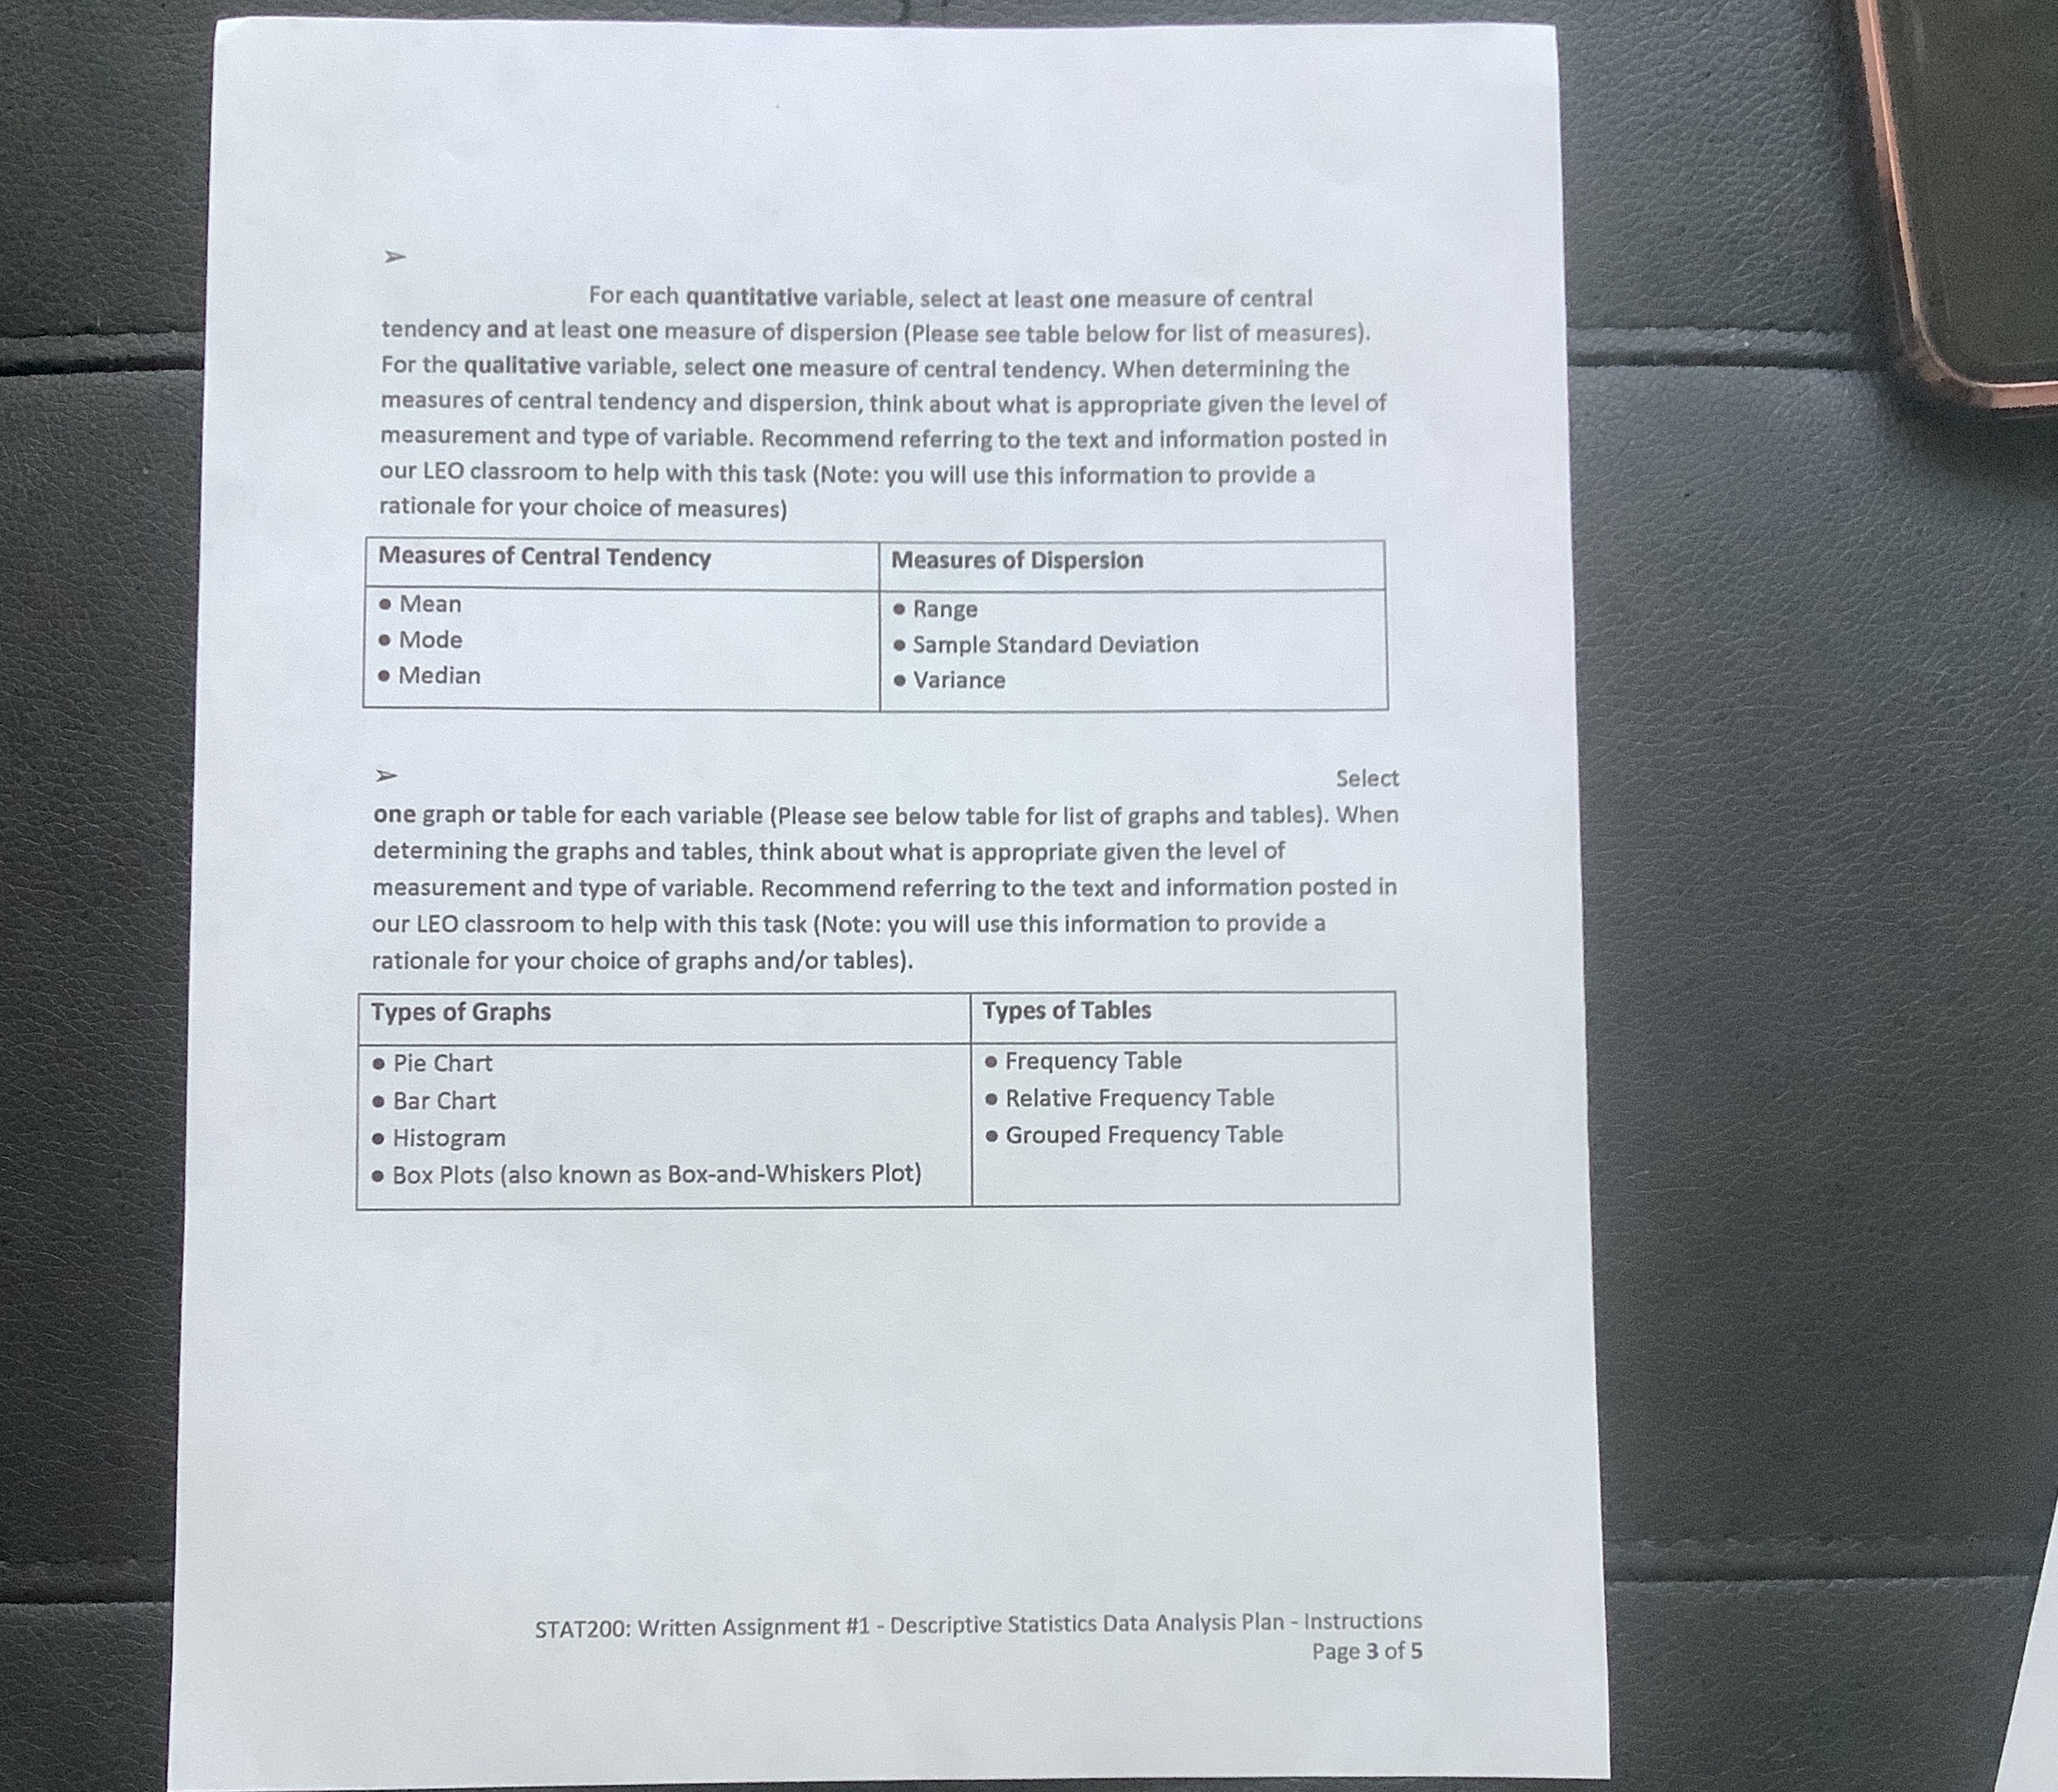
For each quantitative variable, select at least one measure of central tendency and at least one measure of dispersion (Please see table below for list of measures). For the qualitative variable, select one measure of central tendency. When determining the measures of central tendency and dispersion, think about what is appropriate given the level of measurement and type of variable. Recommend referring to the text and Information posted in our LEO classroom to help with this task (Note: you will use this information to provide a rationale for your choice of measures) Measures of Central Tendency Measures of Dispersion 0 Range 0 Sample Standard Deviation o Variance > Select one graph or table for each variable (Please see below table for list of graphs and tables). When determining the graphs and tables, think about what is appropriate given the level of measurement and type of variable. Recommend referring to the text and information posted in our LEO classroom to help with this task (Note: you will use this information to provide a rationale for your choice of graphs and/or tables). Types of Graphs Types of Tables . Pie Chart 0 Frequency Table 0 Bar Chart 0 Relative Frequency Table 0 Histogram o Grouped Frequency Table a Box Plots (also known as Box-and-Whiskers Plot) ST ATZOO: Written Assignment #1 Descriptive Statistics Data Analysis Plan - Instructions Page 3 of 5
Step by Step Solution
There are 3 Steps involved in it

Get step-by-step solutions from verified subject matter experts