

Question: Instructions: Use the raw data in the Intel tabs to... (1 of 3) Create common size statements in the Common Size tab. (2 of 3)
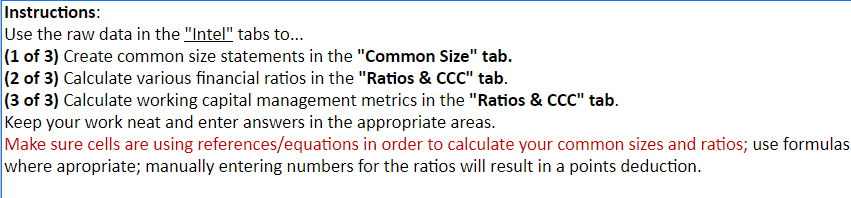
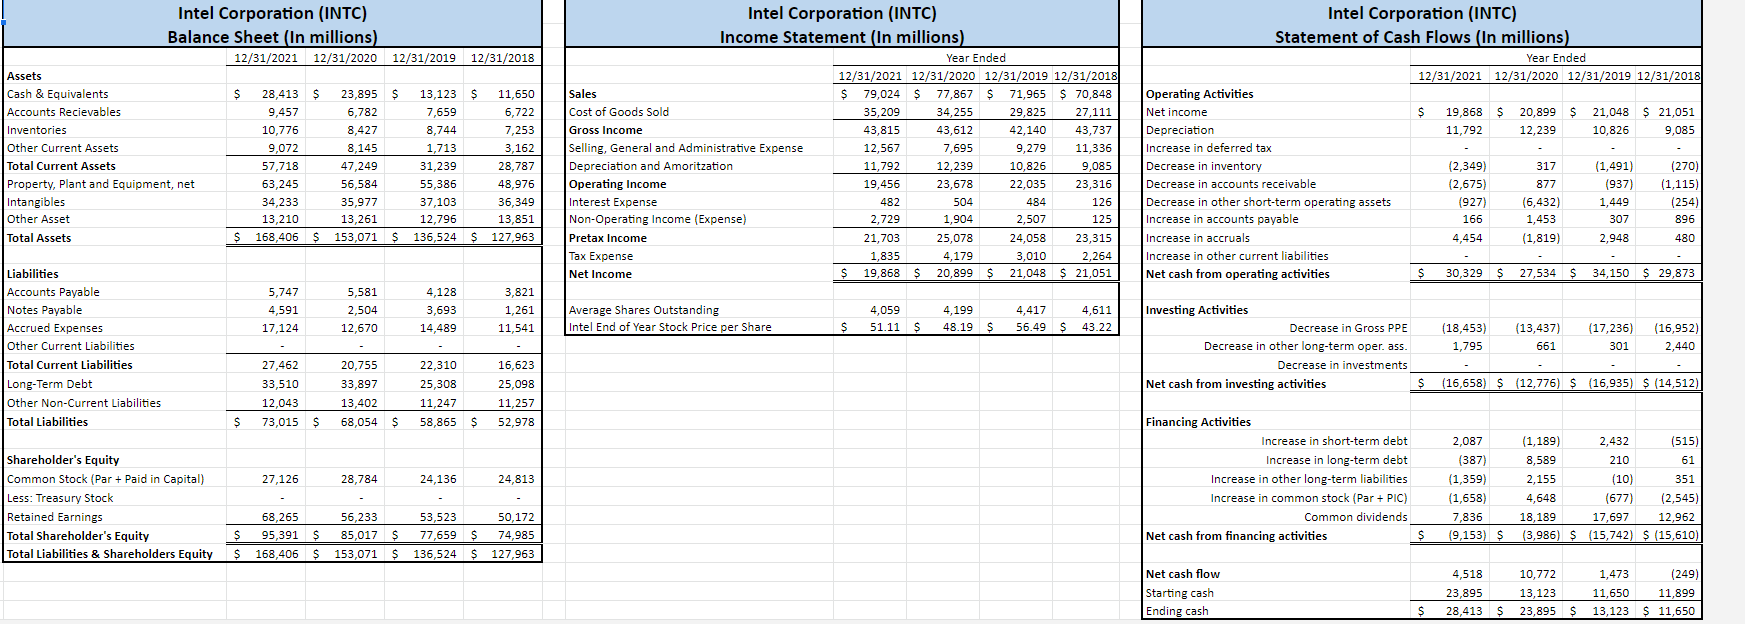
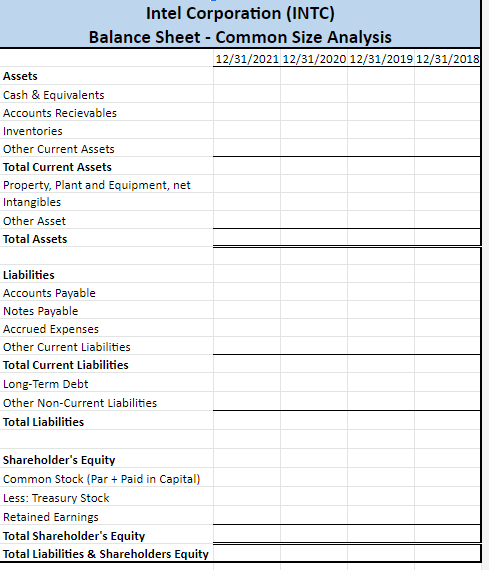
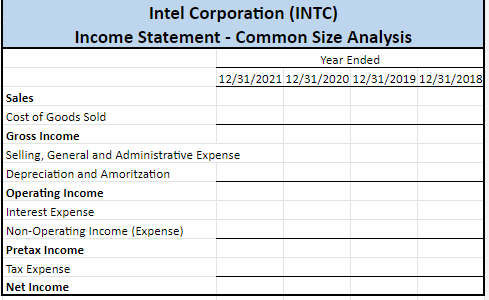
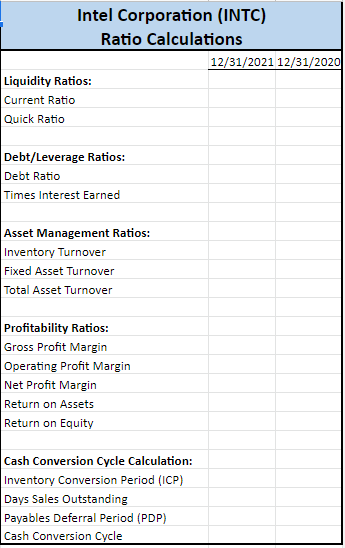
Instructions: Use the raw data in the "Intel" tabs to... (1 of 3) Create common size statements in the "Common Size" tab. (2 of 3) Calculate various financial ratios in the "Ratios & CCC" tab. (3 of 3) Calculate working capital management metrics in the "Ratios & CCC" tab. Keep your work neat and enter answers in the appropriate areas. Make sure cells are using references/equations in order to calculate your common sizes and ratios; use formulas where apropriate; manually entering numbers for the ratios will result in a points deduction. 7,659 Intel Corporation (INTC) Balance Sheet (In millions) 12/31/2021 12/31/2020 12/31/2019 12/31/2018 Assets Cash & Equivalents $ 28,413 $ 23,895 $ 13,123 $ 11,650 Accounts Recievables 9,457 6,782 6,722 Inventories 10,776 8,427 8,744 7,253 Other Current Assets 9,072 8,145 1,713 3,162 Total Current Assets 57,718 47,249 31,239 28,787 Property, Plant and Equipment, net 63,245 56,584 55,386 48,976 Intangibles 34,233 35,977 37,103 36,349 Other Asset 13,210 13,261 12,796 13,851 Total Assets $ 168,406 $ 153,071 $ 136,524 $ 127,963 Intel Corporation (INTC) Income Statement (In millions) Year Ended 12/31/2021 12/31/2020 12/31/2019 12/31/2018 Sales $ 79,024 $ 77,867 $ 71,965 $ 70,848 Cost of Goods Sold 35,209 34,255 29,825 27,111 Gross Income 43,815 43,612 42,140 43,737 Selling, General and Administrative Expense 12,567 7,695 9,279 11,336 Depreciation and Amoritzation 11,792 12,239 10,826 9,085 Operating Income 19,456 23,678 22,035 23,316 Interest Expense 482 504 484 126 Non-Operating Income (Expense) 2,729 1,904 2,507 125 Pretax Income 21,703 25,078 24,058 23,315 Tax Expense 1,835 4,179 3,010 2.264 Net Income $ 19,868 $ 20,899 $ 21,048 $ 21,051 Intel Corporation (INTC) Statement of Cash Flows (In millions) Year Ended 12/31/2021 12/31/2020 12/31/2019 12/31/2018 Operating Activities Net income $ 19,868 $ 20,899 $ 21,048 $ 21,051 Depreciation 11,792 12,239 10,826 9,085 Increase in deferred tax Decrease in inventory (2,349) 317 (1,491) (270) Decrease in accounts receivable (2,675) 877 (937) (1,115) Decrease in other short-term operating assets (927) (6,432) 1,449 (254) Increase in accounts payable 166 1,453 307 896 Increase in accruals 4,454 (1,819) 2,948 480 Increase in other current liabilities Net cash from operating activities $ 30,329 $ 27,534 $ 34,150 $ 29,873 5,747 4,591 17,124 5,581 2,504 12,670 4,128 3,693 14,489 3,821 1,261 11,541 Average Shares Outstanding Intel End of Year Stock Price per Share 4,059 51.11 $ 4,199 48.19 $ 4,417 56.49 $ 4,611 43.22 $ Liabilities Accounts Payable Notes Payable Accrued Expenses Other Current Liabilities Total Current Liabilities Long-Term Debt Other Non-Current Liabilities Total Liabilities Investing Activities Decrease in Gross PPE Decrease in other long-term oper. ass. Decrease in investments Net cash from investing activities (18,453) 1,795 (13,437) 661 (17,236) 301 (16,952) 2,440 $ (16,658) $ (12,776) $ (16,935) $ (14,512) 27,462 33,510 12,043 73,015 $ 20,755 33,897 13,402 68,054 $ 22,310 25,308 11,247 58,865 $ 16,623 25,098 11,257 52,978 $ 27,126 28,784 24,136 24,813 Shareholder's Equity Common Stock (Par + Paid in Capital) Less: Treasury Stock Retained Earnings Total Shareholder's Equity Total Liabilities & Shareholders Equity Financing Activities Increase in short-term debt Increase in long-term debt Increase in other long-term liabilities Increase in common stock (Par + PIC) Common dividends Net cash from financing activities 2,087 (387) (1,359) (1,658) 7,836 (9,153) $ (1,189) 2,432 (515) 8,589 210 61 2,155 (10) 351 4,648 (677) (2,545) 18,189 17,697 12,962 (3,986) $ (15,742) $ (15,610) 68,265 $ 95,391 $ 168,406 $ 56,233 85,017 $ 153,071 $ 53,523 50,172 77,659 $ 74,985 136,524 $ $ 127,963 $ $ Net cash flow Starting cash Ending cash 4,518 10,772 23,895 13,123 28,413 $ 23,895 $ 1,473 (249) 11,650 11,899 13,123 $ 11,650 $ $ Intel Corporation (INTC) Balance Sheet - Common Size Analysis 12/31/2021 12/31/2020 12/31/2019 12/31/2018 Assets Cash & Equivalents Accounts Recievables Inventories Other Current Assets Total Current Assets Property, Plant and Equipment, net Intangibles Other Asset Total Assets Liabilities Accounts Payable Notes Payable Accrued Expenses Other Current Liabilities Total Current Liabilities Long-Term Debt Other Non-Current Liabilities Total Liabilities Shareholder's Equity Common Stock (Par + Paid in Capital) Less: Treasury Stock Retained Earnings Total Shareholder's Equity Total Liabilities & Shareholders Equity Intel Corporation (INTC) Income Statement - Common Size Analysis Year Ended 12/31/2021 12/31/2020 12/31/2019 12/31/2018 Sales Cost of Goods Sold Gross Income Selling, General and Administrative Expense Depreciation and Amoritzation Operating Income Interest Expense Non-Operating Inc ne (Expense) Pretax Income Tax Expense Net Income Intel Corporation (INTC) Ratio Calculations 12/31/2021 12/31/2020 Liquidity Ratios: Current Ratio Quick Ratio Debt/Leverage Ratios: Debt Ratio Times Interest Earned Asset Management Ratios: Inventory Turnover Fixed Asset Turnover Total Asset Turnover Profitability Ratios: Gross Profit Margin Operating Profit Margin Net Profit Margin Return on Assets Return on Equity Cash Conversion Cycle Calculation: Inventory Conversion Period (ICP) Days Sales Outstanding Payables Deferral Period (PDP) Cash Conversion Cycle Instructions: Use the raw data in the "Intel" tabs to... (1 of 3) Create common size statements in the "Common Size" tab. (2 of 3) Calculate various financial ratios in the "Ratios & CCC" tab. (3 of 3) Calculate working capital management metrics in the "Ratios & CCC" tab. Keep your work neat and enter answers in the appropriate areas. Make sure cells are using references/equations in order to calculate your common sizes and ratios; use formulas where apropriate; manually entering numbers for the ratios will result in a points deduction. 7,659 Intel Corporation (INTC) Balance Sheet (In millions) 12/31/2021 12/31/2020 12/31/2019 12/31/2018 Assets Cash & Equivalents $ 28,413 $ 23,895 $ 13,123 $ 11,650 Accounts Recievables 9,457 6,782 6,722 Inventories 10,776 8,427 8,744 7,253 Other Current Assets 9,072 8,145 1,713 3,162 Total Current Assets 57,718 47,249 31,239 28,787 Property, Plant and Equipment, net 63,245 56,584 55,386 48,976 Intangibles 34,233 35,977 37,103 36,349 Other Asset 13,210 13,261 12,796 13,851 Total Assets $ 168,406 $ 153,071 $ 136,524 $ 127,963 Intel Corporation (INTC) Income Statement (In millions) Year Ended 12/31/2021 12/31/2020 12/31/2019 12/31/2018 Sales $ 79,024 $ 77,867 $ 71,965 $ 70,848 Cost of Goods Sold 35,209 34,255 29,825 27,111 Gross Income 43,815 43,612 42,140 43,737 Selling, General and Administrative Expense 12,567 7,695 9,279 11,336 Depreciation and Amoritzation 11,792 12,239 10,826 9,085 Operating Income 19,456 23,678 22,035 23,316 Interest Expense 482 504 484 126 Non-Operating Income (Expense) 2,729 1,904 2,507 125 Pretax Income 21,703 25,078 24,058 23,315 Tax Expense 1,835 4,179 3,010 2.264 Net Income $ 19,868 $ 20,899 $ 21,048 $ 21,051 Intel Corporation (INTC) Statement of Cash Flows (In millions) Year Ended 12/31/2021 12/31/2020 12/31/2019 12/31/2018 Operating Activities Net income $ 19,868 $ 20,899 $ 21,048 $ 21,051 Depreciation 11,792 12,239 10,826 9,085 Increase in deferred tax Decrease in inventory (2,349) 317 (1,491) (270) Decrease in accounts receivable (2,675) 877 (937) (1,115) Decrease in other short-term operating assets (927) (6,432) 1,449 (254) Increase in accounts payable 166 1,453 307 896 Increase in accruals 4,454 (1,819) 2,948 480 Increase in other current liabilities Net cash from operating activities $ 30,329 $ 27,534 $ 34,150 $ 29,873 5,747 4,591 17,124 5,581 2,504 12,670 4,128 3,693 14,489 3,821 1,261 11,541 Average Shares Outstanding Intel End of Year Stock Price per Share 4,059 51.11 $ 4,199 48.19 $ 4,417 56.49 $ 4,611 43.22 $ Liabilities Accounts Payable Notes Payable Accrued Expenses Other Current Liabilities Total Current Liabilities Long-Term Debt Other Non-Current Liabilities Total Liabilities Investing Activities Decrease in Gross PPE Decrease in other long-term oper. ass. Decrease in investments Net cash from investing activities (18,453) 1,795 (13,437) 661 (17,236) 301 (16,952) 2,440 $ (16,658) $ (12,776) $ (16,935) $ (14,512) 27,462 33,510 12,043 73,015 $ 20,755 33,897 13,402 68,054 $ 22,310 25,308 11,247 58,865 $ 16,623 25,098 11,257 52,978 $ 27,126 28,784 24,136 24,813 Shareholder's Equity Common Stock (Par + Paid in Capital) Less: Treasury Stock Retained Earnings Total Shareholder's Equity Total Liabilities & Shareholders Equity Financing Activities Increase in short-term debt Increase in long-term debt Increase in other long-term liabilities Increase in common stock (Par + PIC) Common dividends Net cash from financing activities 2,087 (387) (1,359) (1,658) 7,836 (9,153) $ (1,189) 2,432 (515) 8,589 210 61 2,155 (10) 351 4,648 (677) (2,545) 18,189 17,697 12,962 (3,986) $ (15,742) $ (15,610) 68,265 $ 95,391 $ 168,406 $ 56,233 85,017 $ 153,071 $ 53,523 50,172 77,659 $ 74,985 136,524 $ $ 127,963 $ $ Net cash flow Starting cash Ending cash 4,518 10,772 23,895 13,123 28,413 $ 23,895 $ 1,473 (249) 11,650 11,899 13,123 $ 11,650 $ $ Intel Corporation (INTC) Balance Sheet - Common Size Analysis 12/31/2021 12/31/2020 12/31/2019 12/31/2018 Assets Cash & Equivalents Accounts Recievables Inventories Other Current Assets Total Current Assets Property, Plant and Equipment, net Intangibles Other Asset Total Assets Liabilities Accounts Payable Notes Payable Accrued Expenses Other Current Liabilities Total Current Liabilities Long-Term Debt Other Non-Current Liabilities Total Liabilities Shareholder's Equity Common Stock (Par + Paid in Capital) Less: Treasury Stock Retained Earnings Total Shareholder's Equity Total Liabilities & Shareholders Equity Intel Corporation (INTC) Income Statement - Common Size Analysis Year Ended 12/31/2021 12/31/2020 12/31/2019 12/31/2018 Sales Cost of Goods Sold Gross Income Selling, General and Administrative Expense Depreciation and Amoritzation Operating Income Interest Expense Non-Operating Inc ne (Expense) Pretax Income Tax Expense Net Income Intel Corporation (INTC) Ratio Calculations 12/31/2021 12/31/2020 Liquidity Ratios: Current Ratio Quick Ratio Debt/Leverage Ratios: Debt Ratio Times Interest Earned Asset Management Ratios: Inventory Turnover Fixed Asset Turnover Total Asset Turnover Profitability Ratios: Gross Profit Margin Operating Profit Margin Net Profit Margin Return on Assets Return on Equity Cash Conversion Cycle Calculation: Inventory Conversion Period (ICP) Days Sales Outstanding Payables Deferral Period (PDP) Cash Conversion Cycle
Step by Step Solution
There are 3 Steps involved in it

Get step-by-step solutions from verified subject matter experts