

Question: Please include formulas. Formating Guidelines Constants/ValueEntries Calculations / Formulas /Text Entry Links from Other Tabs in Workbook STEP 1: Create Common Size Financial Statements STEP
Please include formulas. 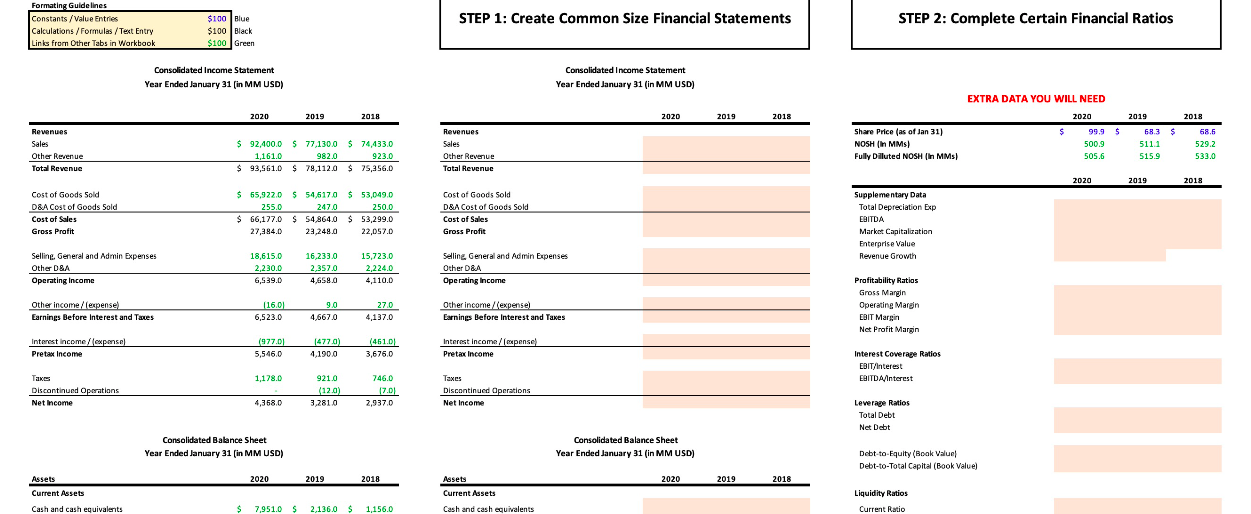
Formating Guidelines Constants/ValueEntries Calculations / Formulas /Text Entry Links from Other Tabs in Workbook STEP 1: Create Common Size Financial Statements STEP 2: Complete Certain Financial Ratios $100 Blue $100 Black $100 Green Consolidated Income Statement Consolidated Income Statement Year Ended January 31 (in MM USD) Year Ended January 31 (in MM USD) 2020 2019 2018 2020 2019 2018 Revenues Sales Other Revenue Total Revenue 2019 68.35 511.1 EXTRA DATA YOU WILL NEED 2020 $ 99.9 $ 500.9 505.6 Revenues Sales Other Revenue Total Revenue Share Price (as of Jan 31) NOSH (in MM) Fully Diluted NOSH (In MM) $ 92,400.0 $ 77,130,0 $ 74,433.0 1,161.0 982.0 923.0 $ $ $ 93,561.0 $ 79,112,0 $ 75,956.D 2018 68.5 529.2 533.0 515.9 2020 2019 2018 Cost of Goods Sold D&A Cost of Goods Sold Cost of Sales Gross Profit $ 55,922.0 $ 54,5170 $ 53,049.0 255.0 247.0 250.0 $ 66,177.0 $ 54,864,0 $ 53,299.0 27,284.0 23,248.0 22,057.0 Cost of Goods Sold D&A Cost of Goods Sold Cost of Sales Gross Profit Supplementary Data Total Depreciation Exp EBITDA Market Capitaluation Enterprise Value Revenue Growth Selline. General and Admin Expenses Other D&A Operating Income 18,615.0 2,230.0 6,539.0 16,233.0 2,357.0 4,658.0 15,723.0 2,224.0 4,110.0 Selling General and Admin Expenses Other D&A Operating Income Other income/lexpense Earnings Before Interest and Taxes (16.01 6,523.0 90 4,6670 27.0 4,137.0 Other income /expense) Earnings Before Interest and Taxes Profitability Ratias Gross Margin Operating Maren EBIT Margin Net Profit Margin Interest income /expense Pret Income 1977.0) 5,546,0 1477.0) 4.1900 (461.01 3,676,0 Interest income (expense Pretax income Interest Coverage Ratios EBIT/Interest EBITDA/Interest 1,178.0 Takes Discontinued Operations Net Income 9210 ( (12.0) 3,281.0 746.0 17.01 2,937,0 Taxes Discontinued Operations Net Income 4,358,0 Leverage Ratios Total Debt Net Debt Consolidated Balance Sheet Year Ended January 31 (in MM USD) Consolidated Balance Sheet Year Ended January 31 (in MM USD) Debt-to-Equity (Book Valuel Debt-to-Total Capital (Book Value) Assets 2020 2019 2018 2020 2019 2018 Assets Current Assets Current Assets Liquidity Ratios Current Ratio Cash and cash equivalents $ 7,951.0 $ 2,136.0 $ 5 1,156.0 Cash and cash equivalents Formating Guidelines Constants/ValueEntries Calculations / Formulas /Text Entry Links from Other Tabs in Workbook STEP 1: Create Common Size Financial Statements STEP 2: Complete Certain Financial Ratios $100 Blue $100 Black $100 Green Consolidated Income Statement Consolidated Income Statement Year Ended January 31 (in MM USD) Year Ended January 31 (in MM USD) 2020 2019 2018 2020 2019 2018 Revenues Sales Other Revenue Total Revenue 2019 68.35 511.1 EXTRA DATA YOU WILL NEED 2020 $ 99.9 $ 500.9 505.6 Revenues Sales Other Revenue Total Revenue Share Price (as of Jan 31) NOSH (in MM) Fully Diluted NOSH (In MM) $ 92,400.0 $ 77,130,0 $ 74,433.0 1,161.0 982.0 923.0 $ $ $ 93,561.0 $ 79,112,0 $ 75,956.D 2018 68.5 529.2 533.0 515.9 2020 2019 2018 Cost of Goods Sold D&A Cost of Goods Sold Cost of Sales Gross Profit $ 55,922.0 $ 54,5170 $ 53,049.0 255.0 247.0 250.0 $ 66,177.0 $ 54,864,0 $ 53,299.0 27,284.0 23,248.0 22,057.0 Cost of Goods Sold D&A Cost of Goods Sold Cost of Sales Gross Profit Supplementary Data Total Depreciation Exp EBITDA Market Capitaluation Enterprise Value Revenue Growth Selline. General and Admin Expenses Other D&A Operating Income 18,615.0 2,230.0 6,539.0 16,233.0 2,357.0 4,658.0 15,723.0 2,224.0 4,110.0 Selling General and Admin Expenses Other D&A Operating Income Other income/lexpense Earnings Before Interest and Taxes (16.01 6,523.0 90 4,6670 27.0 4,137.0 Other income /expense) Earnings Before Interest and Taxes Profitability Ratias Gross Margin Operating Maren EBIT Margin Net Profit Margin Interest income /expense Pret Income 1977.0) 5,546,0 1477.0) 4.1900 (461.01 3,676,0 Interest income (expense Pretax income Interest Coverage Ratios EBIT/Interest EBITDA/Interest 1,178.0 Takes Discontinued Operations Net Income 9210 ( (12.0) 3,281.0 746.0 17.01 2,937,0 Taxes Discontinued Operations Net Income 4,358,0 Leverage Ratios Total Debt Net Debt Consolidated Balance Sheet Year Ended January 31 (in MM USD) Consolidated Balance Sheet Year Ended January 31 (in MM USD) Debt-to-Equity (Book Valuel Debt-to-Total Capital (Book Value) Assets 2020 2019 2018 2020 2019 2018 Assets Current Assets Current Assets Liquidity Ratios Current Ratio Cash and cash equivalents $ 7,951.0 $ 2,136.0 $ 5 1,156.0 Cash and cash equivalents
Step by Step Solution
There are 3 Steps involved in it

Get step-by-step solutions from verified subject matter experts