

Question: Instructions: Utilize the provided template for formatting your memo; do not change any of the margins, line spacing, or fonts. You may utilize figures or
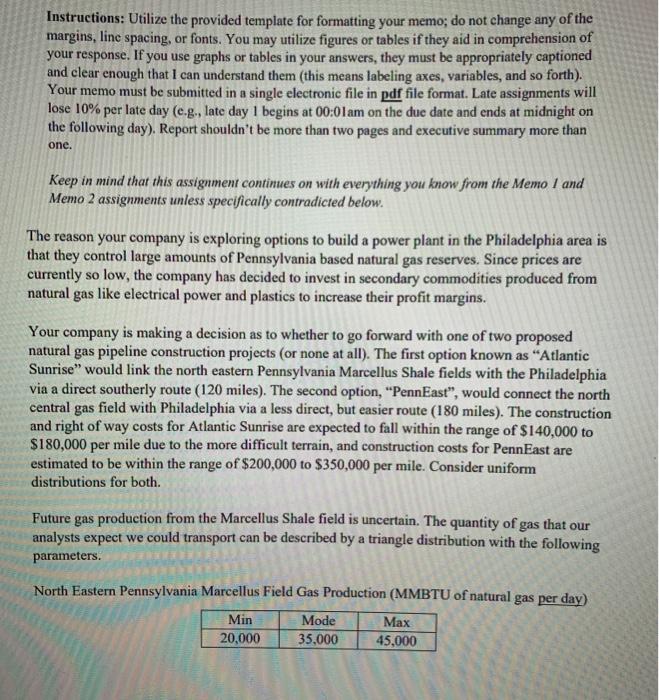
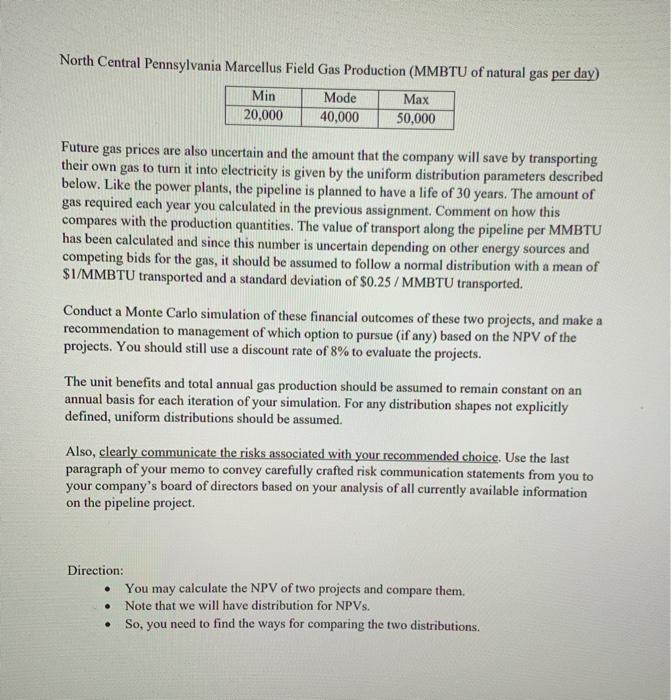
Instructions: Utilize the provided template for formatting your memo; do not change any of the margins, line spacing, or fonts. You may utilize figures or tables if they aid in comprehension of your response. If you use graphs or tables in your answers, they must be appropriately captioned and clear enough that I can understand them (this means labeling axes, variables, and so forth). Your memo must be submitted in a single electronic file in pdf file format. Late assignments will lose 10% per late day (e.g., late day 1 begins at 00:01 am on the due date and ends at midnight on the following day). Report shouldn't be more than two pages and executive summary more than one. Keep in mind that this assignment continues on with everything you know from the Memo I and Memo 2 assignments unless specifically contradicted below. The reason your company is exploring options to build a power plant in the Philadelphia area is that they control large amounts of Pennsylvania based natural gas reserves. Since prices are currently so low, the company has decided to invest in secondary commodities produced from natural gas like electrical power and plastics to increase their profit margins. Your company is making a decision as to whether to go forward with one of two proposed natural gas pipeline construction projects (or none at all). The first option known as Atlantic Sunrise" would link the north eastern Pennsylvania Marcellus Shale fields with the Philadelphia via a direct southerly route (120 miles). The second option, "PennEast", would connect the north central gas field with Philadelphia via a less direct, but easier route (180 miles). The construction and right of way costs for Atlantic Sunrise are expected to fall within the range of $140,000 to $180,000 per mile due to the more difficult terrain, and construction costs for PennEast are estimated to be within the range of $200,000 to $350,000 per mile. Consider uniform distributions for both. Future gas production from the Marcellus Shale field is uncertain. The quantity of gas that our analysts expect we could transport can be described by a triangle distribution with the following parameters North Eastern Pennsylvania Marcellus Field Gas Production (MMBTU of natural gas per day) Min Mode Max 20,000 35,000 45,000 North Central Pennsylvania Marcellus Field Gas Production (MMBTU of natural gas per day) Min Mode Max 20,000 40,000 50,000 Future gas prices are also uncertain and the amount that the company will save by transporting their own gas to turn it into electricity is given by the uniform distribution parameters described below. Like the power plants, the pipeline is planned to have a life of 30 years. The amount of gas required each year you calculated in the previous assignment. Comment on how this compares with the production quantities. The value of transport along the pipeline per MMBTU has been calculated and since this number is uncertain depending on other energy sources and competing bids for the gas, it should be assumed to follow a normal distribution with a mean of $1/MMBTU transported and a standard deviation of $0.25/MMBTU transported. Conduct a Monte Carlo simulation of these financial outcomes of these two projects, and make a recommendation to management of which option to pursue (if any) based on the NPV of the projects. You should still use a discount rate of 8% to evaluate the projects. The unit benefits and total annual gas production should be assumed to remain constant on an annual basis for each iteration of your simulation. For any distribution shapes not explicitly defined, uniform distributions should be assumed. Also, clearly communicate the risks associated with your recommended choice. Use the last paragraph of your memo to convey carefully crafted risk communication statements from you to your company's board of directors based on your analysis of all currently available information on the pipeline project. Direction: You may calculate the NPV of two projects and compare them. Note that we will have distribution for NPVs. So, you need to find the ways for comparing the two distributions. Instructions: Utilize the provided template for formatting your memo; do not change any of the margins, line spacing, or fonts. You may utilize figures or tables if they aid in comprehension of your response. If you use graphs or tables in your answers, they must be appropriately captioned and clear enough that I can understand them (this means labeling axes, variables, and so forth). Your memo must be submitted in a single electronic file in pdf file format. Late assignments will lose 10% per late day (e.g., late day 1 begins at 00:01 am on the due date and ends at midnight on the following day). Report shouldn't be more than two pages and executive summary more than one. Keep in mind that this assignment continues on with everything you know from the Memo I and Memo 2 assignments unless specifically contradicted below. The reason your company is exploring options to build a power plant in the Philadelphia area is that they control large amounts of Pennsylvania based natural gas reserves. Since prices are currently so low, the company has decided to invest in secondary commodities produced from natural gas like electrical power and plastics to increase their profit margins. Your company is making a decision as to whether to go forward with one of two proposed natural gas pipeline construction projects (or none at all). The first option known as Atlantic Sunrise" would link the north eastern Pennsylvania Marcellus Shale fields with the Philadelphia via a direct southerly route (120 miles). The second option, "PennEast", would connect the north central gas field with Philadelphia via a less direct, but easier route (180 miles). The construction and right of way costs for Atlantic Sunrise are expected to fall within the range of $140,000 to $180,000 per mile due to the more difficult terrain, and construction costs for PennEast are estimated to be within the range of $200,000 to $350,000 per mile. Consider uniform distributions for both. Future gas production from the Marcellus Shale field is uncertain. The quantity of gas that our analysts expect we could transport can be described by a triangle distribution with the following parameters North Eastern Pennsylvania Marcellus Field Gas Production (MMBTU of natural gas per day) Min Mode Max 20,000 35,000 45,000 North Central Pennsylvania Marcellus Field Gas Production (MMBTU of natural gas per day) Min Mode Max 20,000 40,000 50,000 Future gas prices are also uncertain and the amount that the company will save by transporting their own gas to turn it into electricity is given by the uniform distribution parameters described below. Like the power plants, the pipeline is planned to have a life of 30 years. The amount of gas required each year you calculated in the previous assignment. Comment on how this compares with the production quantities. The value of transport along the pipeline per MMBTU has been calculated and since this number is uncertain depending on other energy sources and competing bids for the gas, it should be assumed to follow a normal distribution with a mean of $1/MMBTU transported and a standard deviation of $0.25/MMBTU transported. Conduct a Monte Carlo simulation of these financial outcomes of these two projects, and make a recommendation to management of which option to pursue (if any) based on the NPV of the projects. You should still use a discount rate of 8% to evaluate the projects. The unit benefits and total annual gas production should be assumed to remain constant on an annual basis for each iteration of your simulation. For any distribution shapes not explicitly defined, uniform distributions should be assumed. Also, clearly communicate the risks associated with your recommended choice. Use the last paragraph of your memo to convey carefully crafted risk communication statements from you to your company's board of directors based on your analysis of all currently available information on the pipeline project. Direction: You may calculate the NPV of two projects and compare them. Note that we will have distribution for NPVs. So, you need to find the ways for comparing the two distributions
Step by Step Solution
There are 3 Steps involved in it

Get step-by-step solutions from verified subject matter experts