

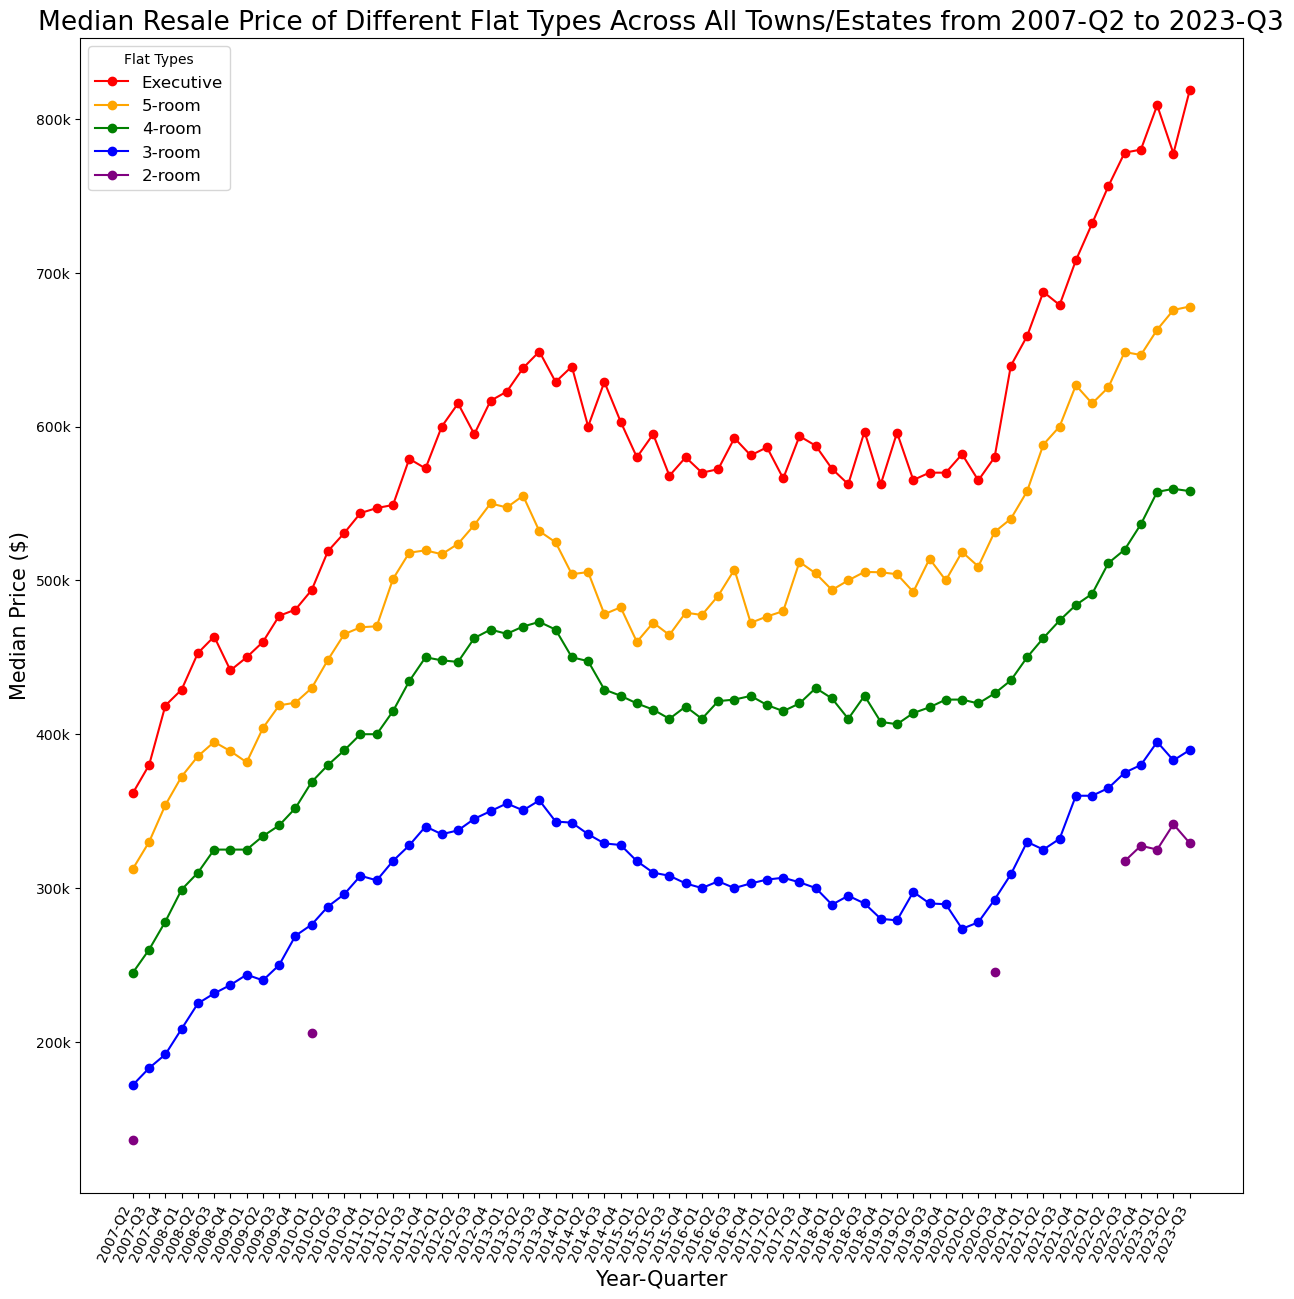
Question: Interpret data of this line chart. - for each flat type - trend of the prices in the years
Interpret data of this line chart.
for each flat type
trend of the prices in the years
Step by Step Solution
There are 3 Steps involved in it
1 Expert Approved Answer
Step: 1 Unlock

Question Has Been Solved by an Expert!
Get step-by-step solutions from verified subject matter experts
Step: 2 Unlock
Step: 3 Unlock