

Question: Interpret statistically the data shown on the table.. COVID-19 LITERACY SCALE 90 80 70 60 666 6 50 40 30 20 10 01 02 Q3
Interpret statistically the data shown on the table..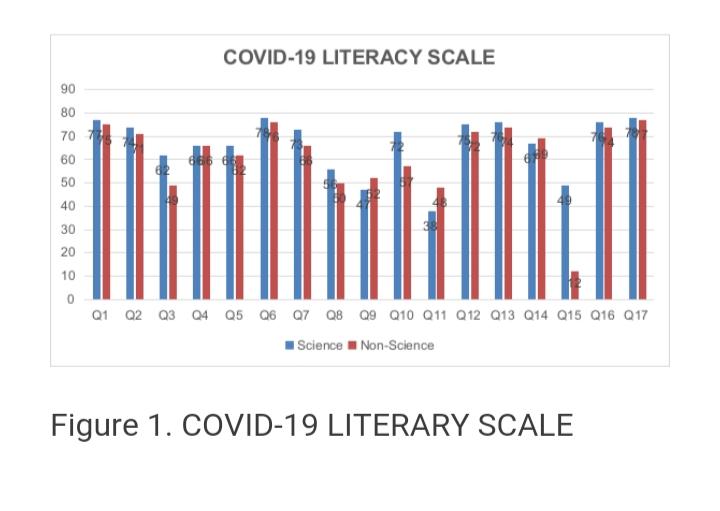
COVID-19 LITERACY SCALE 90 80 70 60 666 6 50 40 30 20 10 01 02 Q3 04 Q5 06 07 Q8 a9 Q10 Q11 Q12 Q13 Q14 Q15 Q16 Q17 Science Non-Science Figure 1. COVID-19 LITERARY SCALE COVID-19 LITERACY SCALE 90 80 70 60 666 6 50 40 30 20 10 01 02 Q3 04 Q5 06 07 Q8 a9 Q10 Q11 Q12 Q13 Q14 Q15 Q16 Q17 Science Non-Science Figure 1. COVID-19 LITERARY SCALE COVID-19 LITERACY SCALE 90 80 70 60 666 6 50 40 30 20 10 01 02 Q3 04 Q5 06 07 Q8 a9 Q10 Q11 Q12 Q13 Q14 Q15 Q16 Q17 Science Non-Science Figure 1. COVID-19 LITERARY SCALE
Step by Step Solution
There are 3 Steps involved in it
type of statistics ac... View full answer

Get step-by-step solutions from verified subject matter experts