

Question: Interpret the data comparing it to the data in December 2017, which year the company perform better. Create a pie graph for December 2018, using
- Interpret the data comparing it to the data in December 2017, which year the company perform better.
- Create a pie graph for December 2018, using the data from vertical analysis.
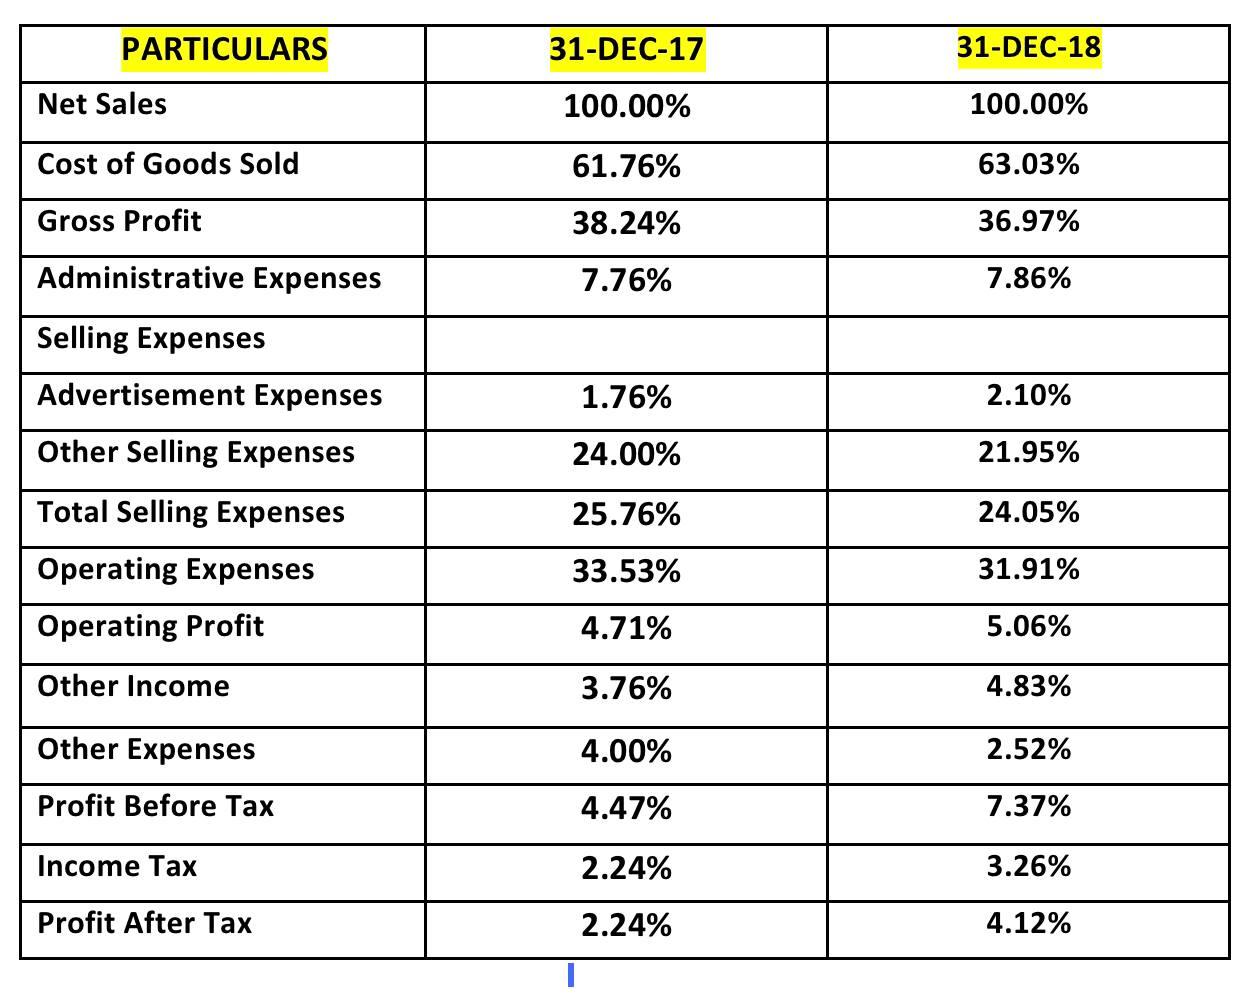
PARTICULARS 31-DEC-17 31-DEC-18 Net Sales 100.00% 100.00% Cost of Goods Sold 61.76% 63.03% Gross Profit 38.24% 36.97% Administrative Expenses 7.76% 7.86% Selling Expenses Advertisement Expenses 1.76% 2.10% Other Selling Expenses 24.00% 21.95% Total Selling Expenses 25.76% 24.05% Operating Expenses 33.53% 31.91% Operating Profit 4.71% 5.06% Other Income 3.76% 4.83% Other Expenses 4.00% 2.52% Profit Before Tax 4.47% 7.37% Income Tax 2.24% 3.26% Profit After Tax 2.24% 4.12%
Step by Step Solution
There are 3 Steps involved in it
1 Expert Approved Answer
Step: 1 Unlock

Question Has Been Solved by an Expert!
Get step-by-step solutions from verified subject matter experts
Step: 2 Unlock
Step: 3 Unlock