

Question: Interpret the data provided in Exhibits 1 and 2 for the Netflix case. What can you take away from the information provided in these exhibits
Interpret the data provided in Exhibits 1 and 2 for the Netflix case. What can you take away from the information provided in these exhibits that can explain Netflix's actions for the period 2012 and 2013.
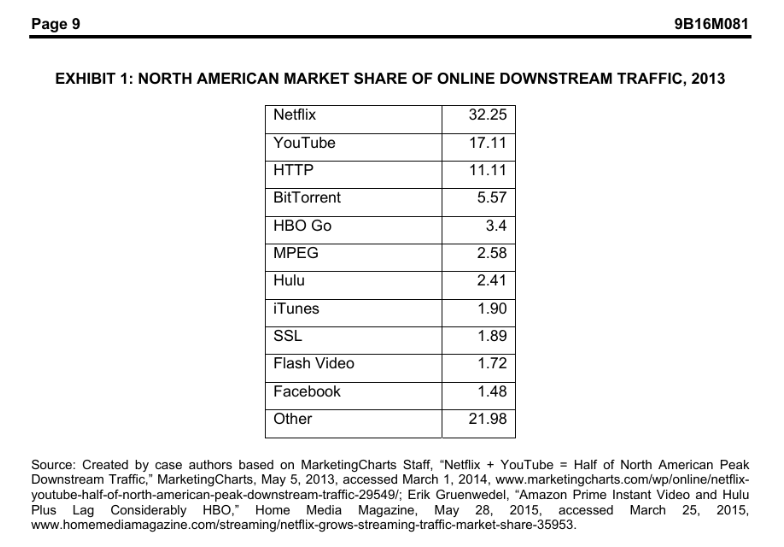
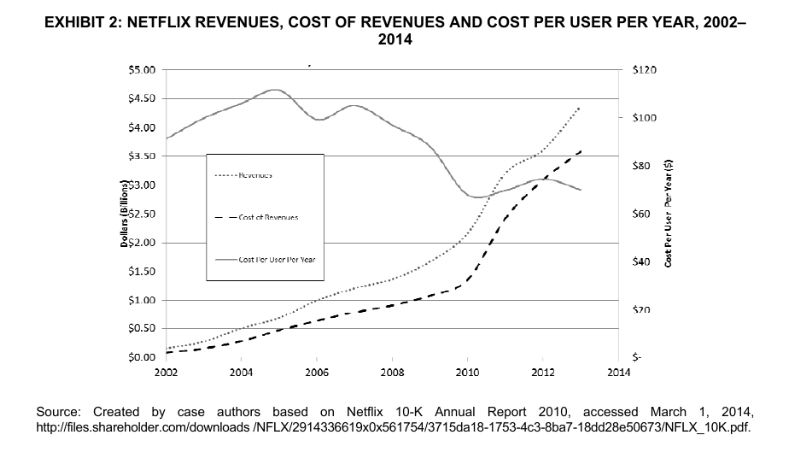
Page 9 9B16M081 EXHIBIT 1: NORTH AMERICAN MARKET SHARE OF ONLINE DOWNSTREAM TRAFFIC, 2013 Netflix 32.25 YouTube 17.11 HTTP 11.11 BitTorrent 5.57 HBO Go 3.4 MPEG 2.58 Hulu 2.41 iTunes 1.90 SSL 1.89 Flash Video 1.72 Facebook 1.48 Other 21.98 Source: Created by case authors based on MarketingCharts Staff, "Netflix + YouTube = Half of North American Peak Downstream Traffic," MarketingCharts, May 5, 2013, accessed March 1, 2014, www.marketingcharts.com/wp/onlineetflix- youtube-half-of-north-american-peak-downstream-traffic-29549/; Erik Gruenwedel, "Amazon Prime Instant Video and Hulu Plus Lag Considerably HBO," Home Media Magazine, May 28, 2015, accessed March 25, 2015, www.homemediamagazine.com/streamingetflix-grows-streaming-traffic-market-share-35953.EXHIBIT 2: NETFLIX REVENUES, COST OF REVENUES AND COST PER USER PER YEAR, 2002- 2014 $5.00 $120 $4.50 $100 $4.00 $3.50 $80 $3.00 Dollars (Billions) 252.50 - - Get ot Amvenues $60 Cost Per User Per Year ($) $2.00 Cont lor Upor Per Year $40 $1.50 $1.00 $0.50 $0.00 S- 2002 2004 2006 2008 2010 2012 2014 Source: Created by case authors based on Netflix 10-K Annual Report 2010, accessed March 1, 2014, http://files.shareholder.com/downloads /NFLX/2914336619x0x561754/3715da18-1753-4c3-8ba7-18dd28e50673/NFLX_10K.pdf
Step by Step Solution
There are 3 Steps involved in it

Get step-by-step solutions from verified subject matter experts