

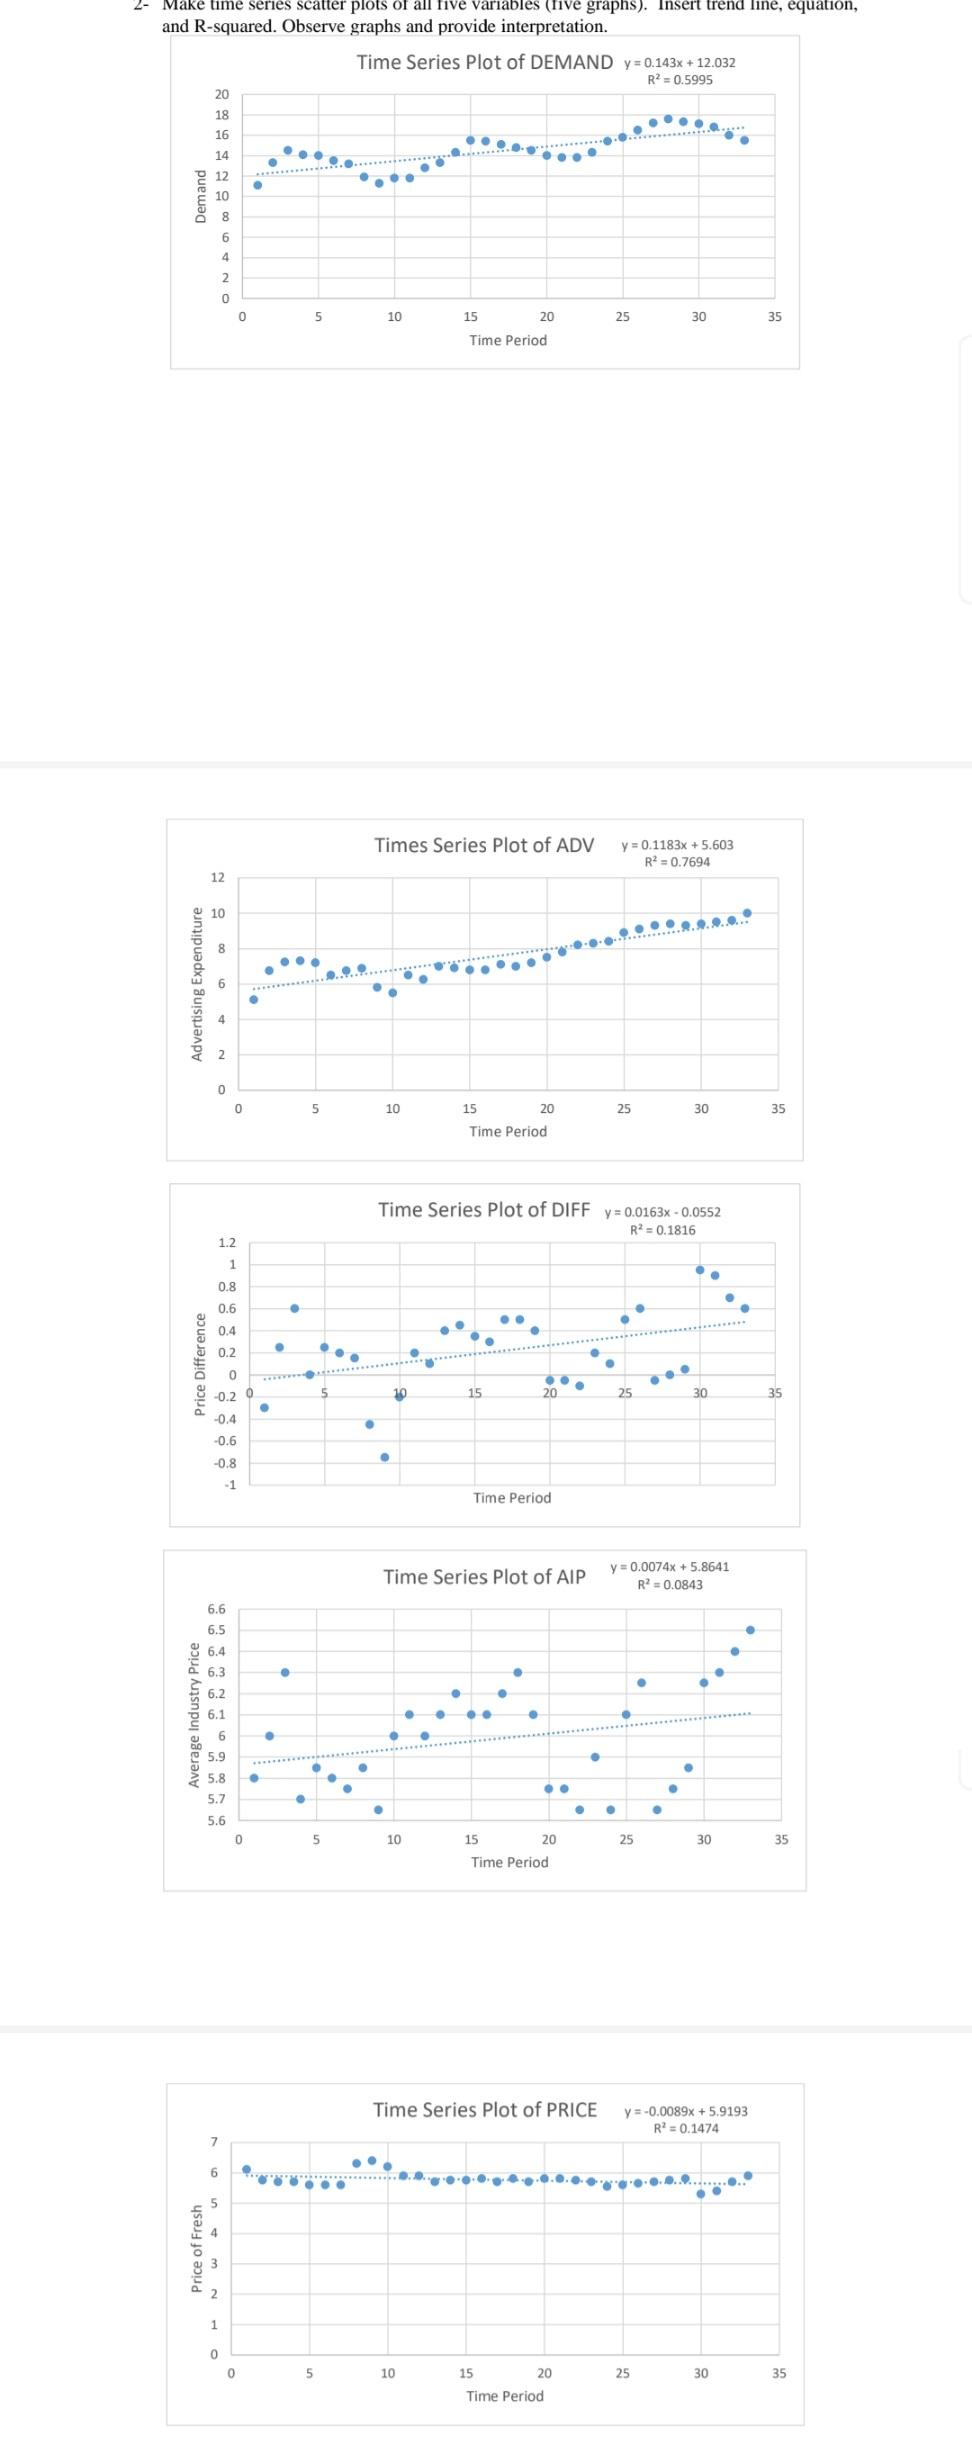
Question: interpret the graphs. Thanks! 2- Make time series scatter plots of all five variables (five graphs). Insert trend line, equation, and R-squared. Observe graphs and
 interpret the graphs. Thanks!
Step by Step Solution
There are 3 Steps involved in it
1 Expert Approved Answer
Step: 1 Unlock

Question Has Been Solved by an Expert!
Get step-by-step solutions from verified subject matter experts
Step: 2 Unlock
Step: 3 Unlock