

Question: Interpret the results using the provided regression analysis below. Descriptive Statistics - Mean Std. Deviation N students|2580.67 895.484 4.472 orrelations students year 1 students[1.000 763
Interpret the results using the provided regression analysis below.
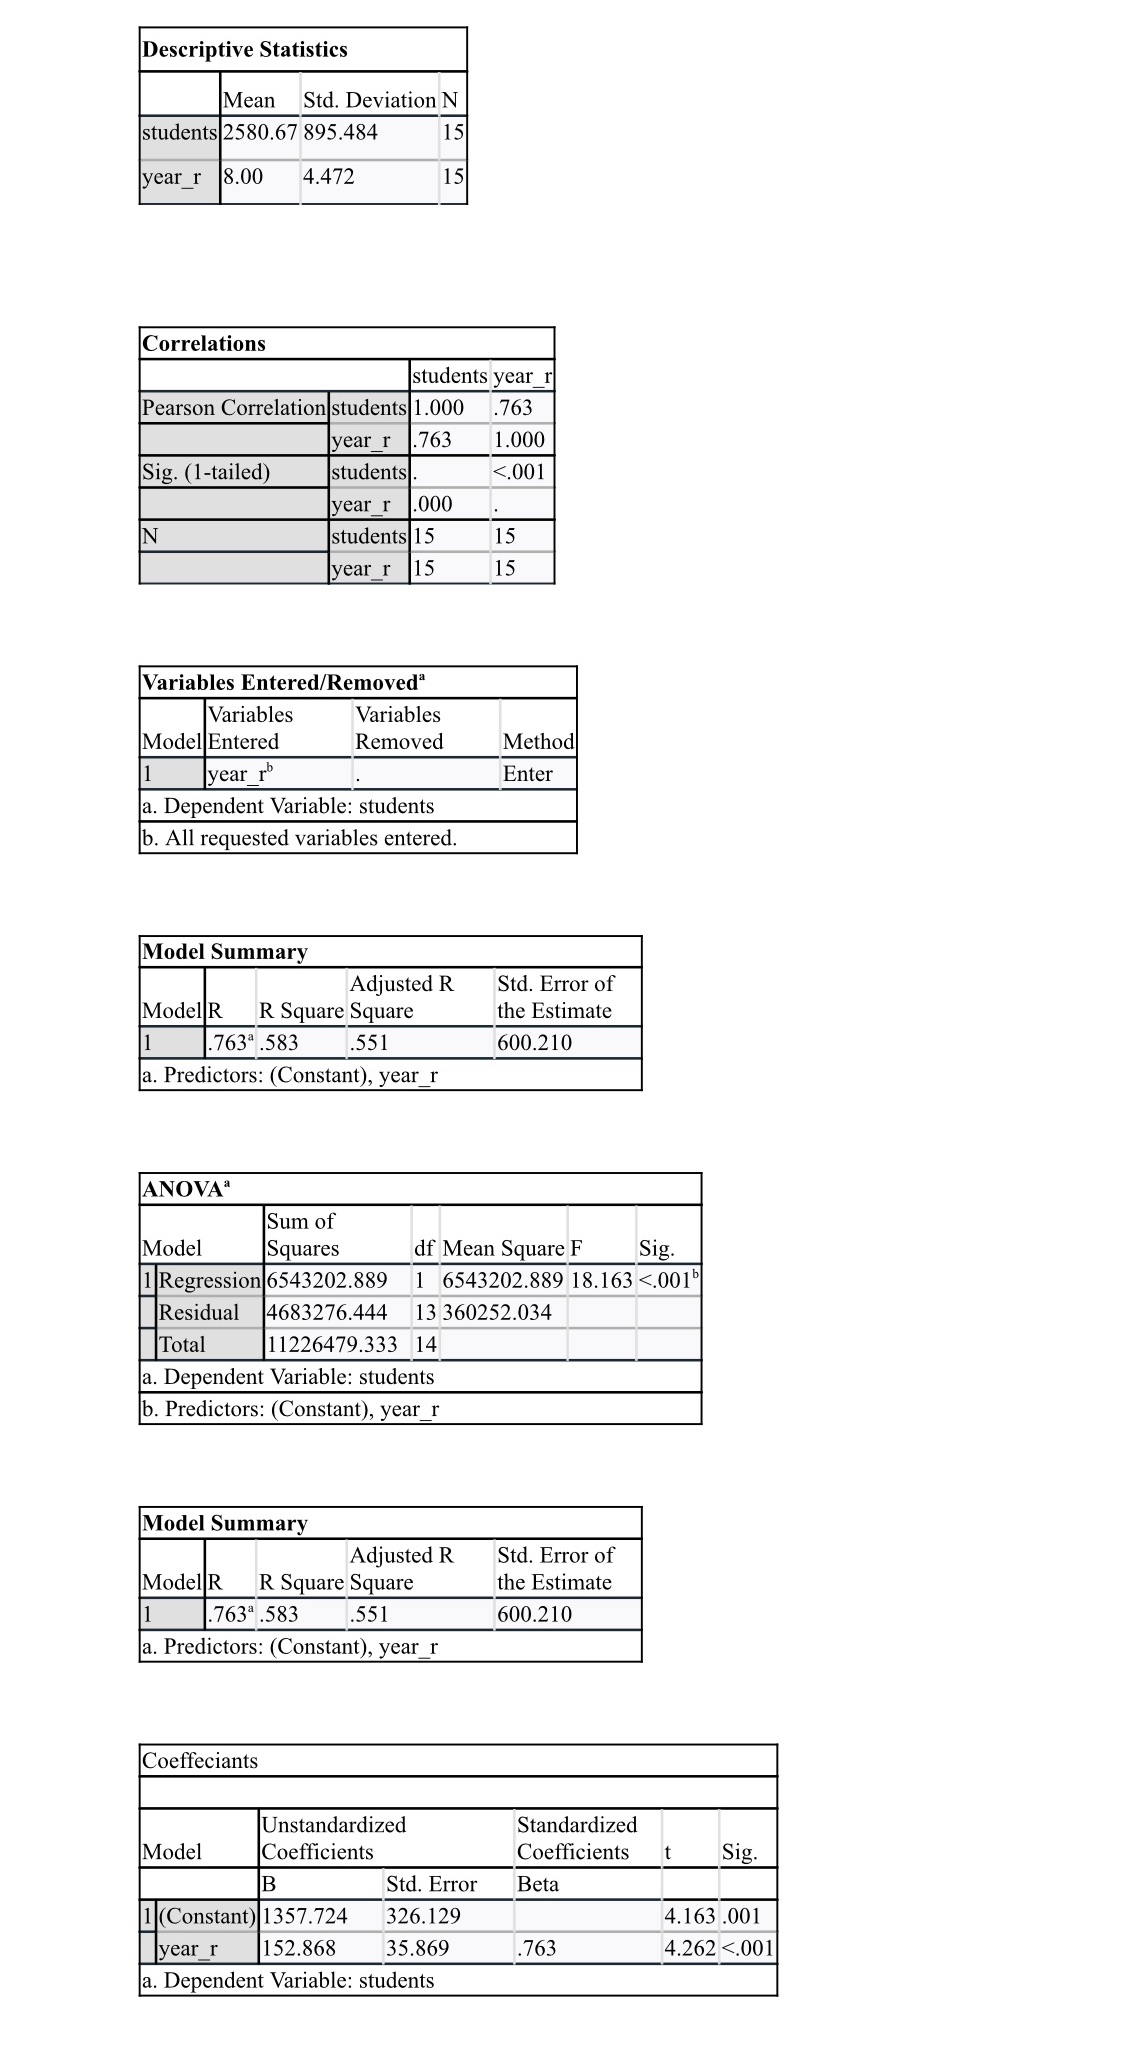
Descriptive Statistics - Mean Std. Deviation N students|2580.67 895.484 4.472 orrelations students year 1 students[1.000 763 _ year_r 1.000 students|. year 1 N [swdentsfIs 'Variables Entered/Removed Variables Removed Adjusted R Std. Error of R Square Square the Estimate 551 600.210 1 6543202.889 18.163 <.001 a. dependent variable: students b. predictors: year r model summary adjusted std. error of square the estimate coeffeciants unstandardized standardized coefficients t sig. beta .001 year_r>
Step by Step Solution
There are 3 Steps involved in it
1 Expert Approved Answer
Step: 1 Unlock

Question Has Been Solved by an Expert!
Get step-by-step solutions from verified subject matter experts
Step: 2 Unlock
Step: 3 Unlock