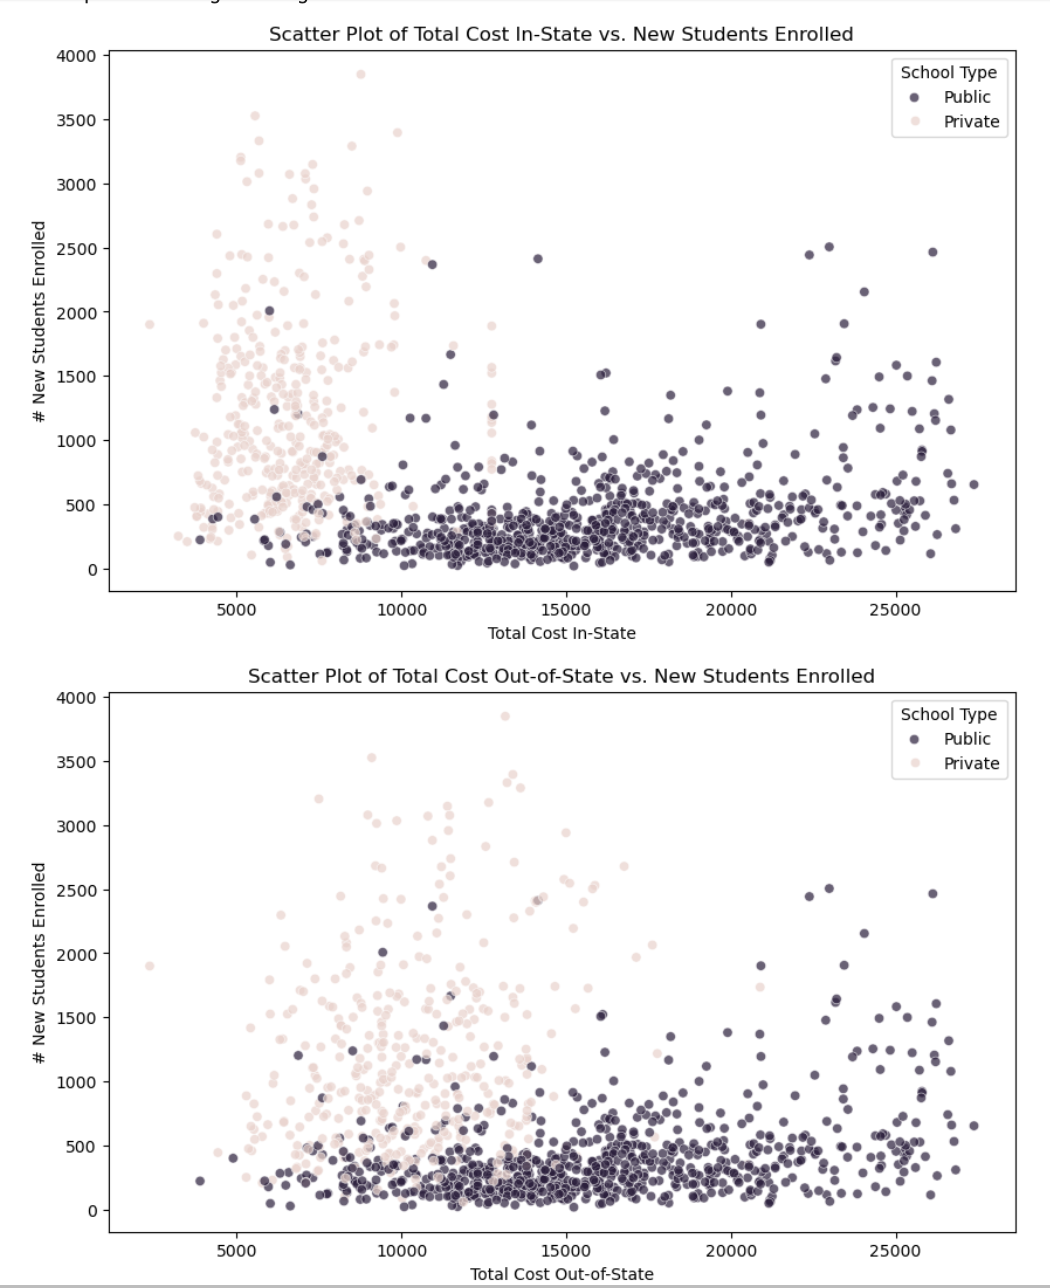
Question: interpret the visualization # New Students Enrolled # New Students Enrolled 4000 3500 3000 2500 2000 1500 1000 500 4000 3500 3000 2500 2000 1500

interpret the visualization

interpret the visualization # New Students
# New Students Enrolled # New Students Enrolled 4000 3500 3000 2500 2000 1500 1000 500 4000 3500 3000 2500 2000 1500 1000 500 - Scatter Plot of Total Cost In-State vs. New Students Enrolled School Type Public Private Total Cost In-State Scatter Plot of Total Cost Out-of-State vs. New Students Enrolled 15000 Total Cost Out-of-State 20000 School Type Public Private

Step by Step Solution

There are 3 Steps involved in it

1 Expert Approved Answer
Step: 1 Unlock blur-text-image
Question Has Been Solved by an Expert!

Get step-by-step solutions from verified subject matter experts

Step: 2 Unlock
Step: 3 Unlock

Students Have Also Explored These Related Mathematics Questions!