

Question: Interpret these ratios individually. Write an analysis report on these ratio of 1000 words and discuss the performance of the Company? EPS-Basic EPS-Diluted Net Profit
Interpret these ratios individually. Write an analysis report on these ratio of 1000 words and discuss the performance of the Company?
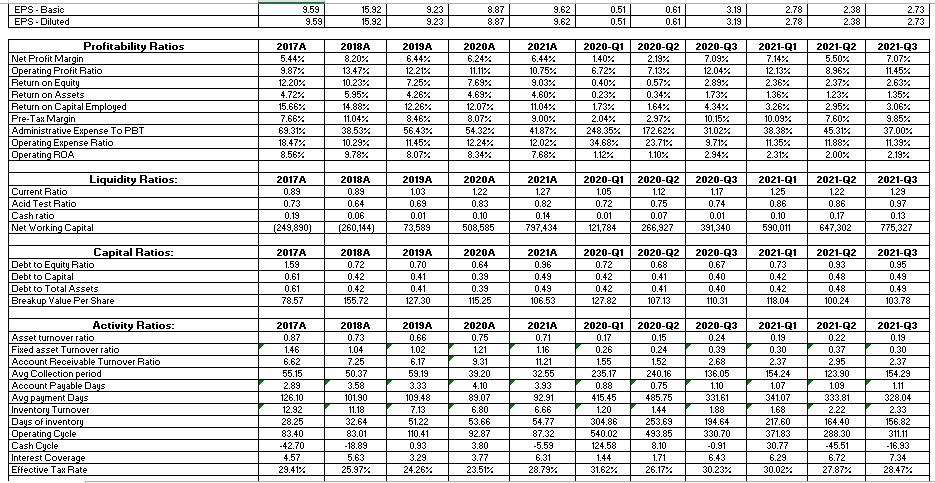
EPS-Basic EPS-Diluted Net Profit Margin Operating Profit Ratio Return on Equity Return on Assets Return on Capital Employed Pre-Tax Margin Administrative Expense To PBT Operating Expense Ratio Operating ROA Liquidity Ratios: Current Ratio Acid Test Ratio Cash ratio Net Working Capital Capital Ratios: Debt to Equity Ratio Debt to Capital Debt to Total Assets Breakup Value Per Share Activity Ratios: Asset turnover ratio Fixed asset Turnover ratio Account Receivable Turnover Ratio Avg Collection period Account Payable Days Avg payment Days Inventory Turnover Days of inventory Operating Cycle Cash Cycle Interest Coverage Effective Tax Rate Profitability Ratios 9.59 9.59 15.92 15.92 2017A 2018A 8.20% 5.44% 9.87% 13.47% 12.20% 10.23% 4.72% 5.95% 15.66% 14.88% 7.66% 11.04% 69.31% 38.53% 18.47% 10.29% 8.56% 9.78% 2018A 2017A 0.89 0.89 0.73 0.64 0.19 0.06 (249,890) (260,144) 2017A 2018A 1.59 0.72 0.61 0.42 0.61 0.42 78.57 155.72 2017A 2018A 0.87 0.73 1.46 1.04 6.62 7.25 55.15 50.37 2.89 3.58 126.10 101.90 12.92 11.18 28.25 32.64 83.40 83.01 -42.70 -18.89 4.57 5.63 29.41% 25.97% 9.23 9.23 2019A 6.44% 12.21% 7.25% 4.26% 12.26% 8.46% 56.43% 11.45% 8.07% 2019A 1.03 0.69 0.01 73,589 2019A 0.70 0.41 0.41 127.30 2019A 0.66 1.02 6.17 59.19 3.33 109.48 7.13 51.22 110.41 0.93 3.29 24.26% 8.87 8.87 2020A 6.24% 11.11% 7.69% 4.69% 12.07% 8.07% 54.32% 12.24% 8.34% 2020A 1.22 0.83 0.10 508,585 2020A 0.64 0.39 0.39 115.25 2020A 0.75 1.21 9.31 39.20 4.10 89.07 6.80 53.66 92.87 3.80 3.77 23.51% 9.62 9.62 2021A 6.44% 10.75% 9.03% 4.60% 11.04% 9.00% 41.87% 12.02% 7.68% 2021A 1.27 0.82 0.14 797,434 2021A 0.96 0.49 0.49 106.53 2021A 0.71 1.16 11.21 32.55 3.93 92.91 6.66 54.77 87.32 -5.59 6.31 28.79% 0.51 0.61 3.19 0.51 0.61 3.19 2020-Q2 2020-Q3 2020-Q1 1.40% 2.19% 7.13% 7.09% 12.04% 6.72% 0.40% 0.57% 2.89% 0.23% 0.34% 1.73% 1.73% 1.64% 4.34% 2.04% 2.97% 10.15% 248.35% 172.62% 34.68% 1.12% 23.71% 1.10% 31.02% 9.71% 2.94% 2020-Q1 1.05 2020-Q2 1.12 2020-Q3 1.17 0.72 0.75 0.74 0.01 0.07 0.01 121,784 266,927 391,340 2020-Q1 2020-Q2 2020-Q3 0.67 0.72 0.68 0.42 0.41 0.40 0.42 0.41 0.40 127.82 107.13 110.31 2020-Q1 0.17 2020-Q2 0.15 2020-Q3 0.24 0.26 0.24 0.39 1.55 1.52 2.68 235.17 0.88 240.16 0.75 485.75 1.44 136.05 1.10 331.61 1.88 415.45 1.20 304.86 253.69 194.64 540.02 493.85 330.70 124.58 8.10 -0.91 1.44 1.71 6.43 31.62% 26.17% 30.23% 2.78 2.78 2021-Q1 7.14% 12.13% 2.36% 1.36% 3.26% 10.09% 38.38% 11.35% 2.31% 2021-Q1 1.25 0.86 0.10 590,011 2021-Q1 0.73 0.42 0.42 118.04 2021-Q1 0.19 0.30 2.37 154.24 1.07 341.07 1.68 217.60 371.83 30.77 6.29 30.02% 2.38 2.38 2021-Q2 5.50% 8.96% 2.37% 1.23% 2.95% 7.60% 45.31% 11.88% 2.00% 2021-Q2 1.22 0.86 0.17 647,302 2021-Q2 0.93 0.48 0.48 100.24 2021-Q2 0.22 0.37 2.95 123.90 1.09 333.81 2.22 164.40 288.30 -45.51 6.72 27.87% 2.73 2.73 2021-Q3 7.07% 11.45% 2.63% 1.35% 3.06% 9.85% 37.00% 11.39% 2.19% 2021-Q3 1.29 0.97 0.13 775,327 2021-Q3 0.95 0.49 0.49 103.78 2021-Q3 0.19 0.30 2.37 154.29 1.11 328.04 2.33 156.82 311.11 -16.93 7.34 28.47%
Step by Step Solution
There are 3 Steps involved in it

Get step-by-step solutions from verified subject matter experts