

Question: Interpret these ratios individually(Calculations not the definitions). Write an analysis report on these ratios of 1000 words and discuss the performance of the Company EPS-Basic
Interpret these ratios individually(Calculations not the definitions). Write an analysis report on these ratios of 1000 words and discuss the performance of the Company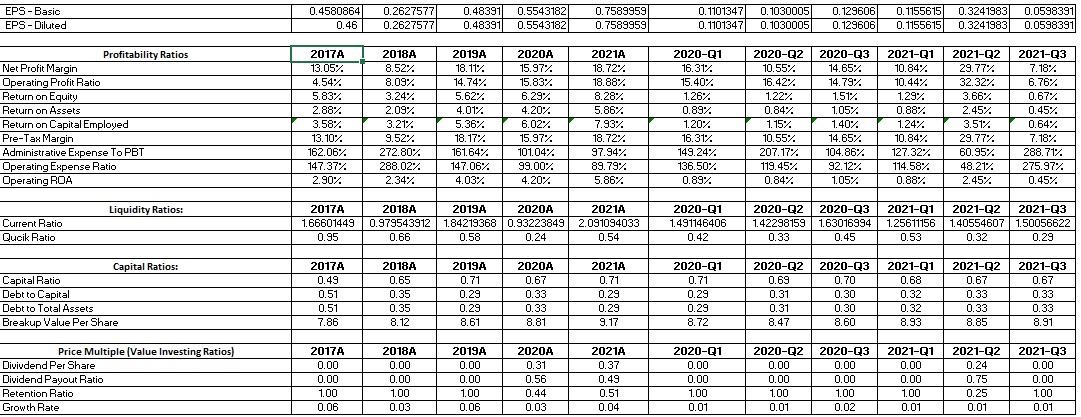
EPS-Basic EPS-Diluted Net Profit Margin Operating Profit Ratio Return on Equity Return on Assets Return on Capital Employed Pre-Tax Margin Administrative Expense To PBT Operating Expense Ratio Operating ROA Current Ratio Qucik Ratio Capital Ratio Debt to Capital Debt to Total Assets Breakup Value Per Share Divivdend Per Share Dividend Payout Ratio Retention Ratio Growth Rate Profitability Ratios Liquidity Ratios: Capital Ratios: Price Multiple (Value Investing Ratios) 0.4580864 0.46 2017A 13.05% 4.54% 5.83% 2.88% 3.58% 13.10% 162.06% 147.37% 2.90% 2017A 1.66601449 0.95 2017A 0.49 0.51 0.51 7.86 2017A 0.00 0.00 1.00 0.06 0.2627577 0.48391 0.5543182 0.2627577 0.48391 0.5543182 2018A 2019A 18.11% 2020A 15.97% 8.52% 8.09% 14.74% 15.83% 3.24% 5.62% 6.29% 2.09% 4.01% 4.20% 3.21% 5.36% 6.02% 9.52% 18.17% 15.97% 161.64% 101.04% 272.80% 288.02% 2.34% 99.00% 147.06% 4.03% 4.20% 2018A 2019A 2020A 0.979543912 1.84219368 0.93223849 0.66 0.58 0.24 2018A 2019A 0.71 2020A 0.67 0.65 0.35 0.29 0.33 0.35 0.29 0.33 8.12 8.61 8.81 2018A 2019A 2020A 0.00 0.00 0.31 0.00 0.00 0.56 1.00 1.00 0.44 0.03 0.06 0.03 0.7589959 0.7589959 2021A 18.72% 18.88% 8.28% 5.86% 7.93% 18.72% 97.94% 89.79% 5.86% 2021A 2.091094033 0.54 2021A 0.71 0.29 0.29 9.17 2021A 0.37 0.49 0.51 0.04 0.1101347 0.1030005 0.129606 0.1101347 0.1030005 0.129606 0.1155615 0.3241983 0.0598391 0.1155615 0.3241983 0.0598391 2021-Q3 2020-Q2 2020-Q3 2021-Q1 2021-Q2 10.55% 29.77% 7.18% 10.84% 10.44% 16.42% 32.32% 6.76% 14.65% 14.79% 1.51% 1.05% 1.22% 1.29% 3.66% 0.67% 0.84% 0.88% 2.45% 0.45% 3.51% 0.64% 1.15% 1.40% 1.24% 10.55% 14.65% 10.84% 207.17% 104.86% 127.32% 119.45% 92.12% 114.58% 0.84% 1.05% 0.88% 7.18% 288.71% 29.77% 60.95% 48.21% 2.45% 275.97% 0.45% 2020-Q2 2020-Q3 1.42298159 1.63016994 0.33 0.45 2021-Q1 2021-Q2 2021-Q3 1.25611156 1.40554607 1.50056622 0.53 0.32 0.29 2020-Q2 0.69 2020-Q3 0.70 2021-Q1 0.68 2021-Q2 0.67 2021-Q3 0.67 0.31 0.30 0.32 0.33 0.33 0.31 0.30 0.32 0.33 0.33 8.47 8.60 8.93 8.85 8.91 2020-Q2 0.00 2020-Q3 0.00 2021-Q1 0.00 2021-Q2 0.24 2021-Q3 0.00 0.00 0.00 0.00 0.75 0.00 1.00 1.00 1.00 0.25 1.00 0.01 0.02 0.01 0.01 0.01 2020-Q1 16.31% 15.40% 1.26% 0.89% 1.20% 16.31% 149.24% 136.50% 0.89% 2020-Q1 1.491146406 0.42 2020-Q1 0.71 0.29 0.29 8.72 2020-Q1 0.00 0.00 1.00 0.01 EPS-Basic EPS-Diluted Net Profit Margin Operating Profit Ratio Return on Equity Return on Assets Return on Capital Employed Pre-Tax Margin Administrative Expense To PBT Operating Expense Ratio Operating ROA Current Ratio Qucik Ratio Capital Ratio Debt to Capital Debt to Total Assets Breakup Value Per Share Divivdend Per Share Dividend Payout Ratio Retention Ratio Growth Rate Profitability Ratios Liquidity Ratios: Capital Ratios: Price Multiple (Value Investing Ratios) 0.4580864 0.46 2017A 13.05% 4.54% 5.83% 2.88% 3.58% 13.10% 162.06% 147.37% 2.90% 2017A 1.66601449 0.95 2017A 0.49 0.51 0.51 7.86 2017A 0.00 0.00 1.00 0.06 0.2627577 0.48391 0.5543182 0.2627577 0.48391 0.5543182 2018A 2019A 18.11% 2020A 15.97% 8.52% 8.09% 14.74% 15.83% 3.24% 5.62% 6.29% 2.09% 4.01% 4.20% 3.21% 5.36% 6.02% 9.52% 18.17% 15.97% 161.64% 101.04% 272.80% 288.02% 2.34% 99.00% 147.06% 4.03% 4.20% 2018A 2019A 2020A 0.979543912 1.84219368 0.93223849 0.66 0.58 0.24 2018A 2019A 0.71 2020A 0.67 0.65 0.35 0.29 0.33 0.35 0.29 0.33 8.12 8.61 8.81 2018A 2019A 2020A 0.00 0.00 0.31 0.00 0.00 0.56 1.00 1.00 0.44 0.03 0.06 0.03 0.7589959 0.7589959 2021A 18.72% 18.88% 8.28% 5.86% 7.93% 18.72% 97.94% 89.79% 5.86% 2021A 2.091094033 0.54 2021A 0.71 0.29 0.29 9.17 2021A 0.37 0.49 0.51 0.04 0.1101347 0.1030005 0.129606 0.1101347 0.1030005 0.129606 0.1155615 0.3241983 0.0598391 0.1155615 0.3241983 0.0598391 2021-Q3 2020-Q2 2020-Q3 2021-Q1 2021-Q2 10.55% 29.77% 7.18% 10.84% 10.44% 16.42% 32.32% 6.76% 14.65% 14.79% 1.51% 1.05% 1.22% 1.29% 3.66% 0.67% 0.84% 0.88% 2.45% 0.45% 3.51% 0.64% 1.15% 1.40% 1.24% 10.55% 14.65% 10.84% 207.17% 104.86% 127.32% 119.45% 92.12% 114.58% 0.84% 1.05% 0.88% 7.18% 288.71% 29.77% 60.95% 48.21% 2.45% 275.97% 0.45% 2020-Q2 2020-Q3 1.42298159 1.63016994 0.33 0.45 2021-Q1 2021-Q2 2021-Q3 1.25611156 1.40554607 1.50056622 0.53 0.32 0.29 2020-Q2 0.69 2020-Q3 0.70 2021-Q1 0.68 2021-Q2 0.67 2021-Q3 0.67 0.31 0.30 0.32 0.33 0.33 0.31 0.30 0.32 0.33 0.33 8.47 8.60 8.93 8.85 8.91 2020-Q2 0.00 2020-Q3 0.00 2021-Q1 0.00 2021-Q2 0.24 2021-Q3 0.00 0.00 0.00 0.00 0.75 0.00 1.00 1.00 1.00 0.25 1.00 0.01 0.02 0.01 0.01 0.01 2020-Q1 16.31% 15.40% 1.26% 0.89% 1.20% 16.31% 149.24% 136.50% 0.89% 2020-Q1 1.491146406 0.42 2020-Q1 0.71 0.29 0.29 8.72 2020-Q1 0.00 0.00 1.00 0.01
Step by Step Solution
There are 3 Steps involved in it

Get step-by-step solutions from verified subject matter experts