

Question: Interpret this graph Process Capability of TOTAL_LOS LSUSE Process Data Within LSL 180 - Overall Target USL 300 Potential (Within) Capability Sample Mean 411.477 0.09
Interpret this graph
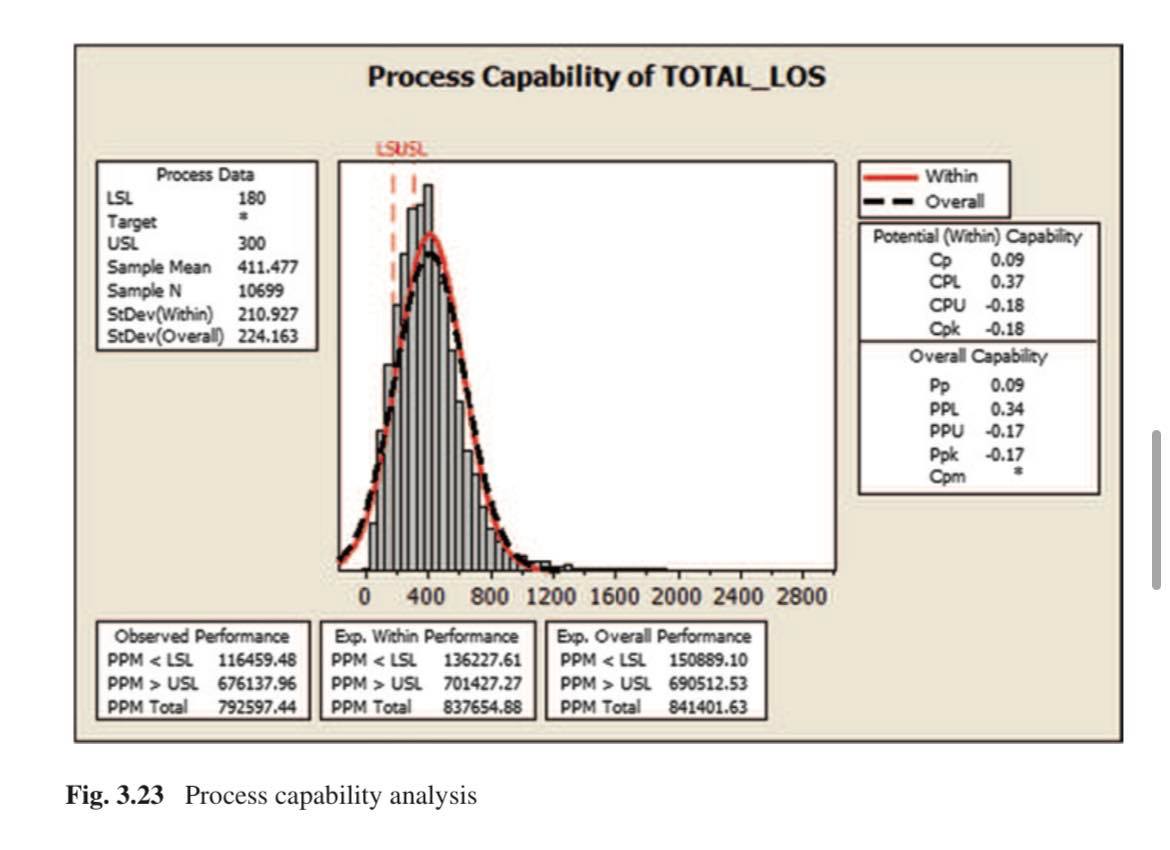
Process Capability of TOTAL_LOS LSUSE Process Data Within LSL 180 - Overall Target USL 300 Potential (Within) Capability Sample Mean 411.477 0.09 CPL 0.37 Sample N 10699 CPU -0.18 StDev(Within) 210.927 StDev(Overall) 224.163 Cpk -0.18 Overall Capability Pp 0.09 PPL 0.34 PPU -0.17 Ppk -0.17 Com 0 400 800 1200 1600 2000 2400 2800 Observed Performance Exp. Within Performance Exp. Overall Performance PPM USL 676137.96 PPM > USL 701427.27 PPM > USL 690512.53 PPM Total 792597.44 PPM Total 837654.88 PPM Total 841401.63 Fig. 3.23 Process capability analysis
Step by Step Solution
There are 3 Steps involved in it
1 Expert Approved Answer
Step: 1 Unlock

Question Has Been Solved by an Expert!
Get step-by-step solutions from verified subject matter experts
Step: 2 Unlock
Step: 3 Unlock