

Question: Interpret this graph using theory background: Why price is declining since 2021? Problem 6: (Excel is not required, 20 points) Interpret this graph using theory
Interpret this graph using theory background: Why price is declining since 2021?
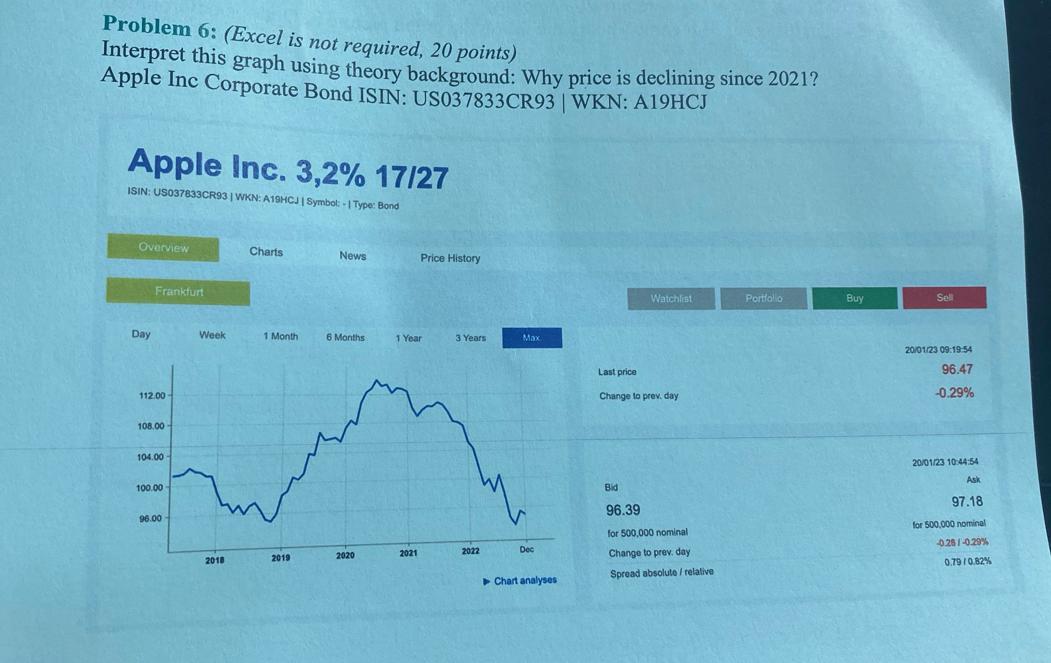
Problem 6: (Excel is not required, 20 points) Interpret this graph using theory background: Why price is declining since 2021? Apple Inc Corporate Bond ISIN: US037833CR93 | WKN: A19HCJ Apple Inc. 3,2% 17/27 ISIN: US037833CR93 | WKN: A19HCJI Symbol: - Type: Bond Overview Day Frankfurt 112.00 108.00- 104.00- 100.00 96.00 Week Charts 2018 1 Month hm 2019 News 6 Months 2020 Price History 1 Year 2021 3 Years 2022 Max Dec Chart analyses Last price Watchlist Change to prev. day Bid 96.39 for 500,000 nominal Change to prev. day Spread absolute / relative Portfolio Buy Sell 20/01/23 09:19:54 96.47 -0.29% 20/01/23 10:44:54 Ask 97.18 for 500,000 nominal -0.28/-0.29% 0.79/0.82%
Step by Step Solution
3.53 Rating (150 Votes )
There are 3 Steps involved in it
The graph shows the price of Apples stock from January 2021 to August 2023 The price of the stock has been declining since 2021 There are a number of ... View full answer

Get step-by-step solutions from verified subject matter experts