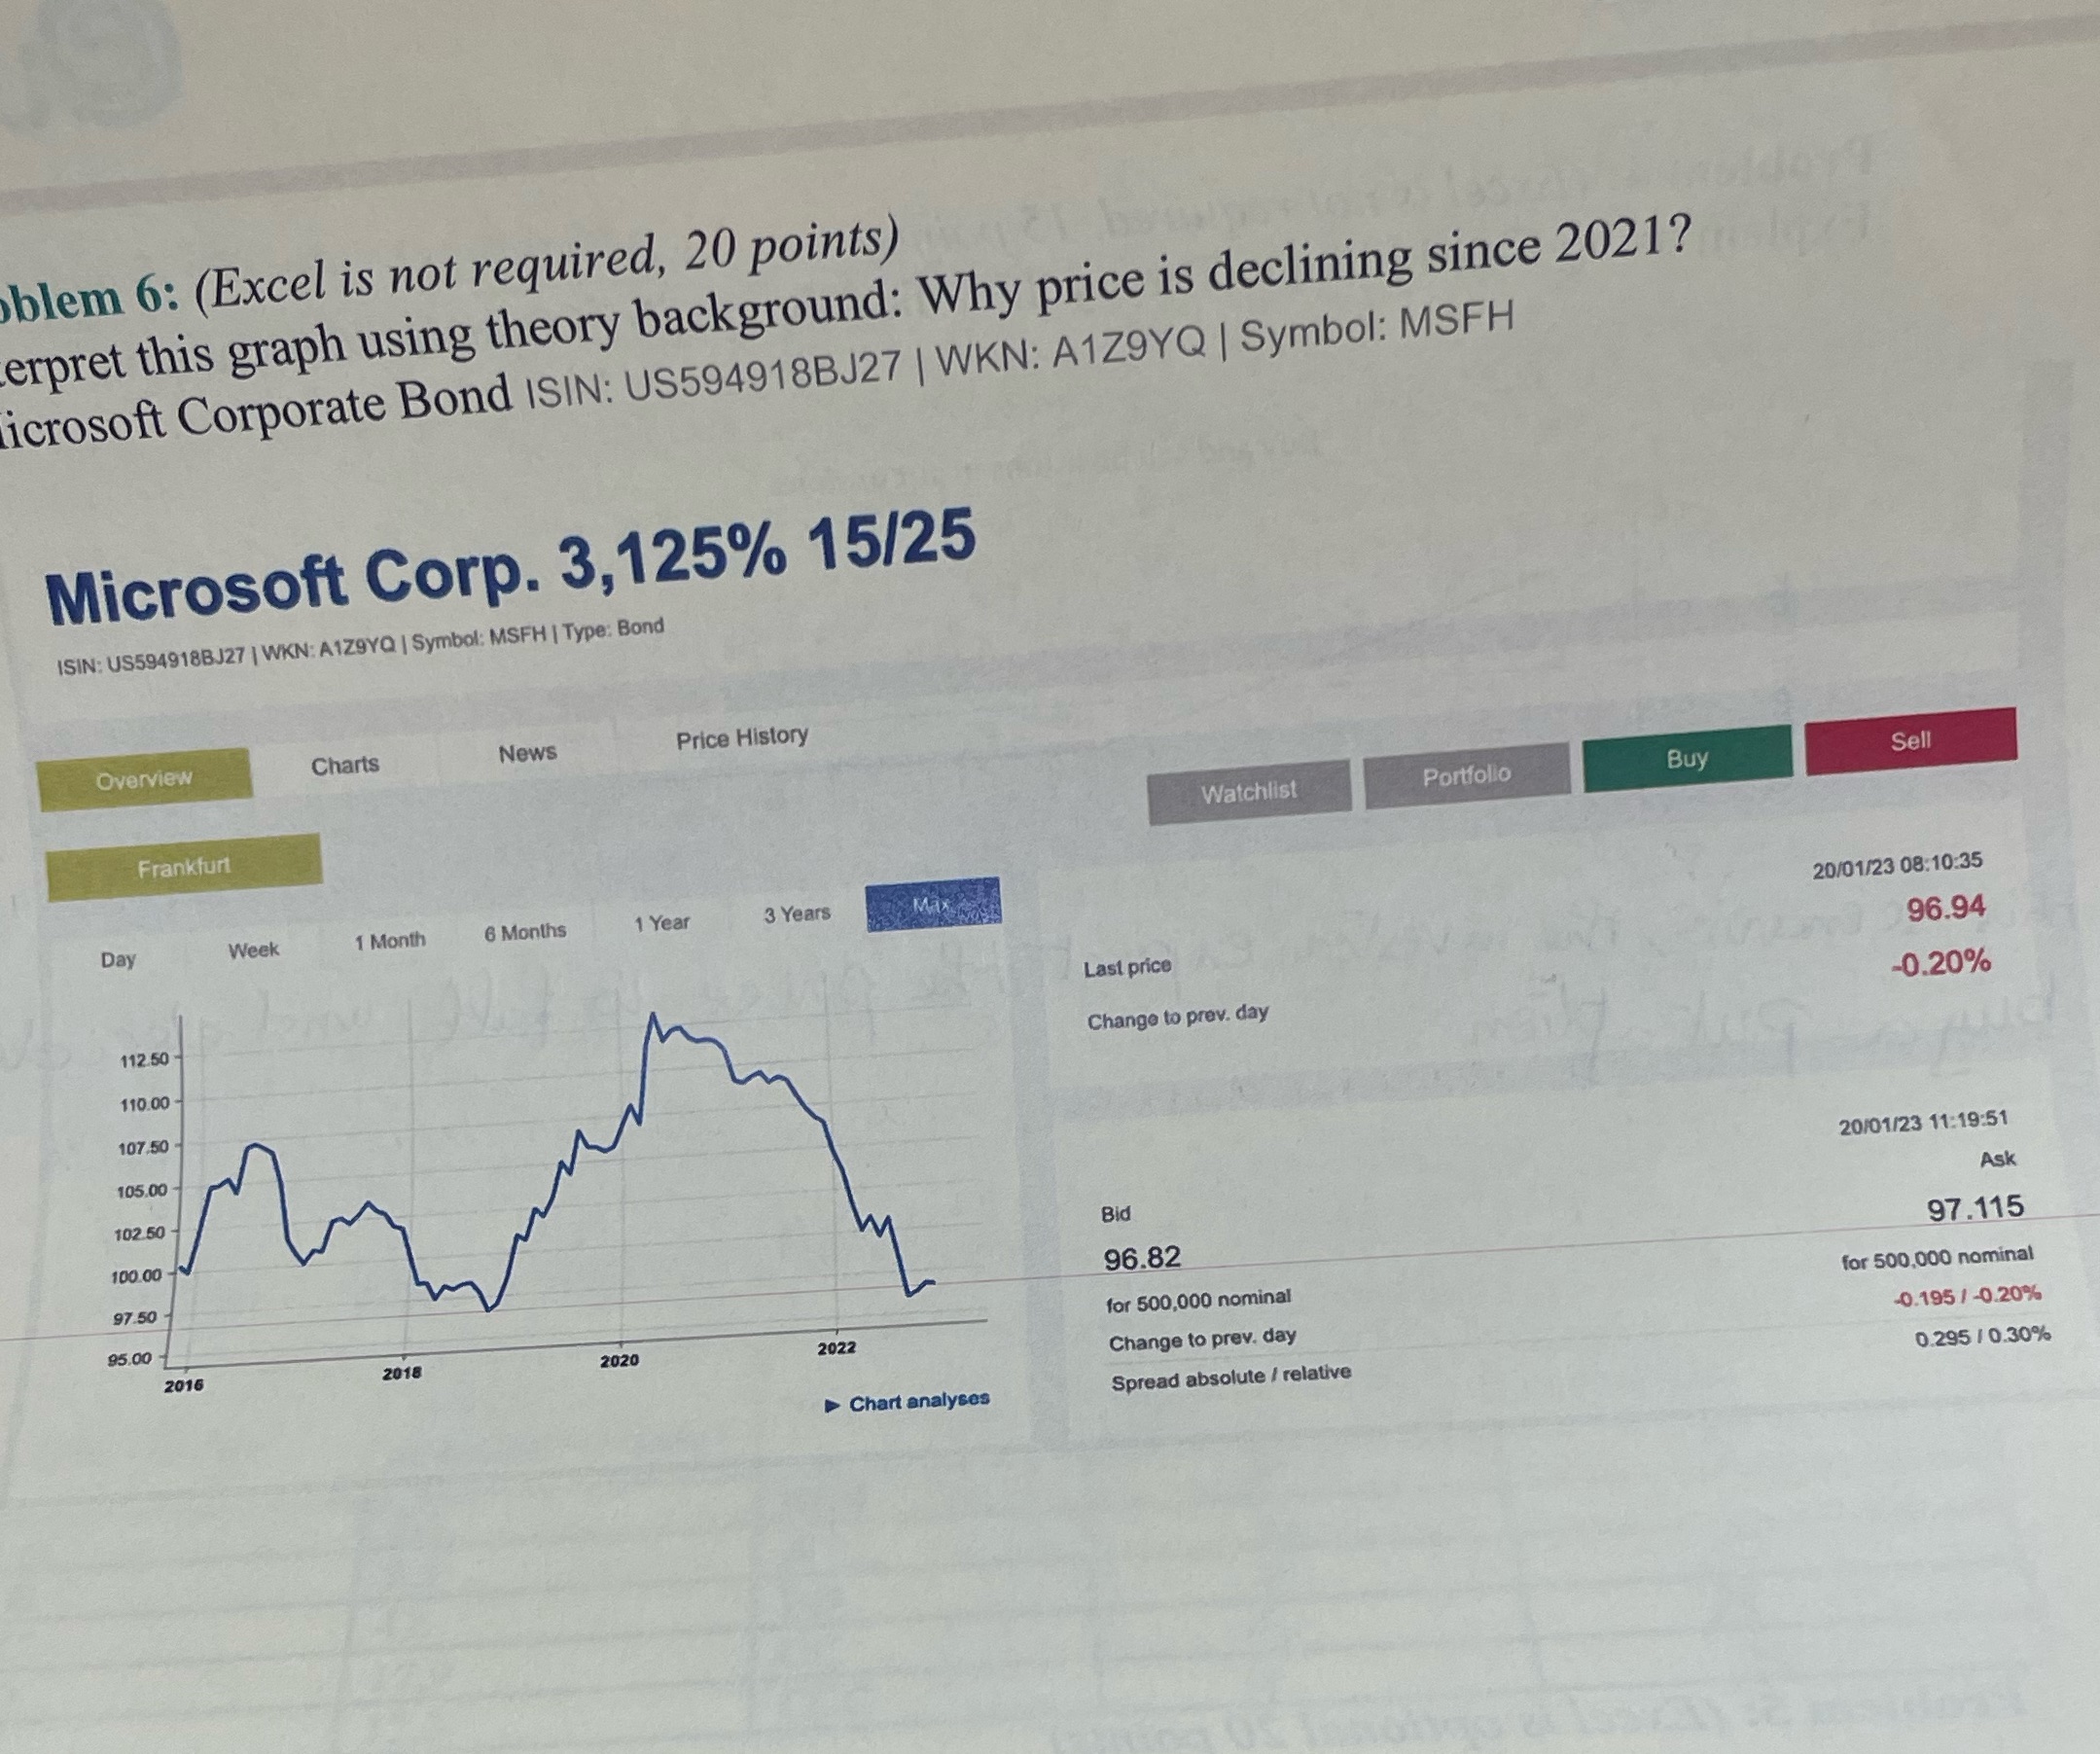
Question: Interpret this graph , why price is declinnig blem 6: (Excel is not required, 20 points) erpret this graph using theory background: Why price is

Interpret this graph , why price is declinnig

Interpret this graph , why price is declinnig
blem 6: (Excel is not required, 20 points) erpret this graph using theory background: Why price is declining since 2021? icrosoft Corporate Bond ISIN: US594918BJ27 | WKN: A129YQ | Symbol: MSFH Microsoft Corp. 3,125% 15/25 ISIN: US594918BJ27 | WKN: A129YQ | Symbol: MSFH | Type: Bond Overview Charts News Price History Buy Sell Watchlist Portfolio Frankfurt Day Week 1 Month 6 Months 1 Year 3 Years 20/01/23 08:10:35 96.94 Last price 112.50 Change to prev. day -0.20% 10.00 107.50 105.00 20/01/23 11:19:51 102.50 Bid Ask 100 00 37.50 96.82 97.115 95.00 for 500,000 nominal for 500,000 nominal 2016 2018 2020 2022 Change to prev. day -0.195 /-0.20% Chart analyses Spread absolute / relative 0.295 / 0.30%

Step by Step Solution

There are 3 Steps involved in it

1 Expert Approved Answer
Step: 1 Unlock blur-text-image
Question Has Been Solved by an Expert!

Get step-by-step solutions from verified subject matter experts

Step: 2 Unlock
Step: 3 Unlock

Students Have Also Explored These Related Finance Questions!