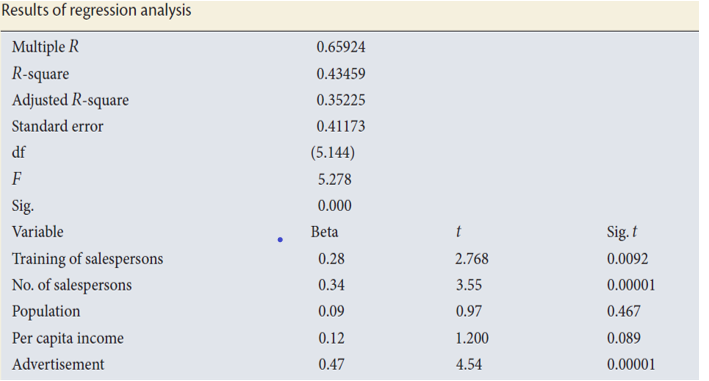
Question: Interpretation the data bel,ow: Results of regression analysis 0.65924 Multiple R R-square Adjusted R-square Standard error df F Sig. Variable Training of salespersons No. of

Interpretation the data bel,ow:

Interpretation the data bel,ow: Results of

Results of regression analysis 0.65924 Multiple R R-square Adjusted R-square Standard error df F Sig. Variable Training of salespersons No. of salespersons Population Per capita income Advertisement 0.43459 0.35225 0.41173 (5.144) 5.278 0.000 Beta t 2.768 0.28 0.34 Sig. 0.0092 0.00001 0.467 3.55 0.97 0.09 0.12 1.200 0.089 0.00001 0.47 4.54

Step by Step Solution

There are 3 Steps involved in it

1 Expert Approved Answer
Step: 1 Unlock blur-text-image
Question Has Been Solved by an Expert!

Get step-by-step solutions from verified subject matter experts

Step: 2 Unlock
Step: 3 Unlock

Students Have Also Explored These Related General Management Questions!