

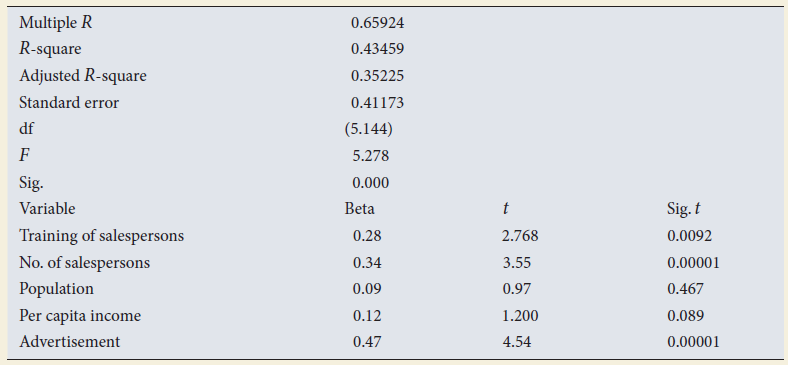
Question: Interpret this output. all the factors representing what relation and their bench mark criteria. 0.65924 Multiple R R-square Adjusted R-square Standard error 0.43459 0.35225 0.41173
Interpret this output. all the factors representing what relation and their bench mark criteria.
Step by Step Solution
There are 3 Steps involved in it
1 Expert Approved Answer
Step: 1 Unlock

Question Has Been Solved by an Expert!
Get step-by-step solutions from verified subject matter experts
Step: 2 Unlock
Step: 3 Unlock