

Question: /: Interpreting Bar Graphs v' The bar graph above shows the percentage of students who received each letter grade on their test English paper. The
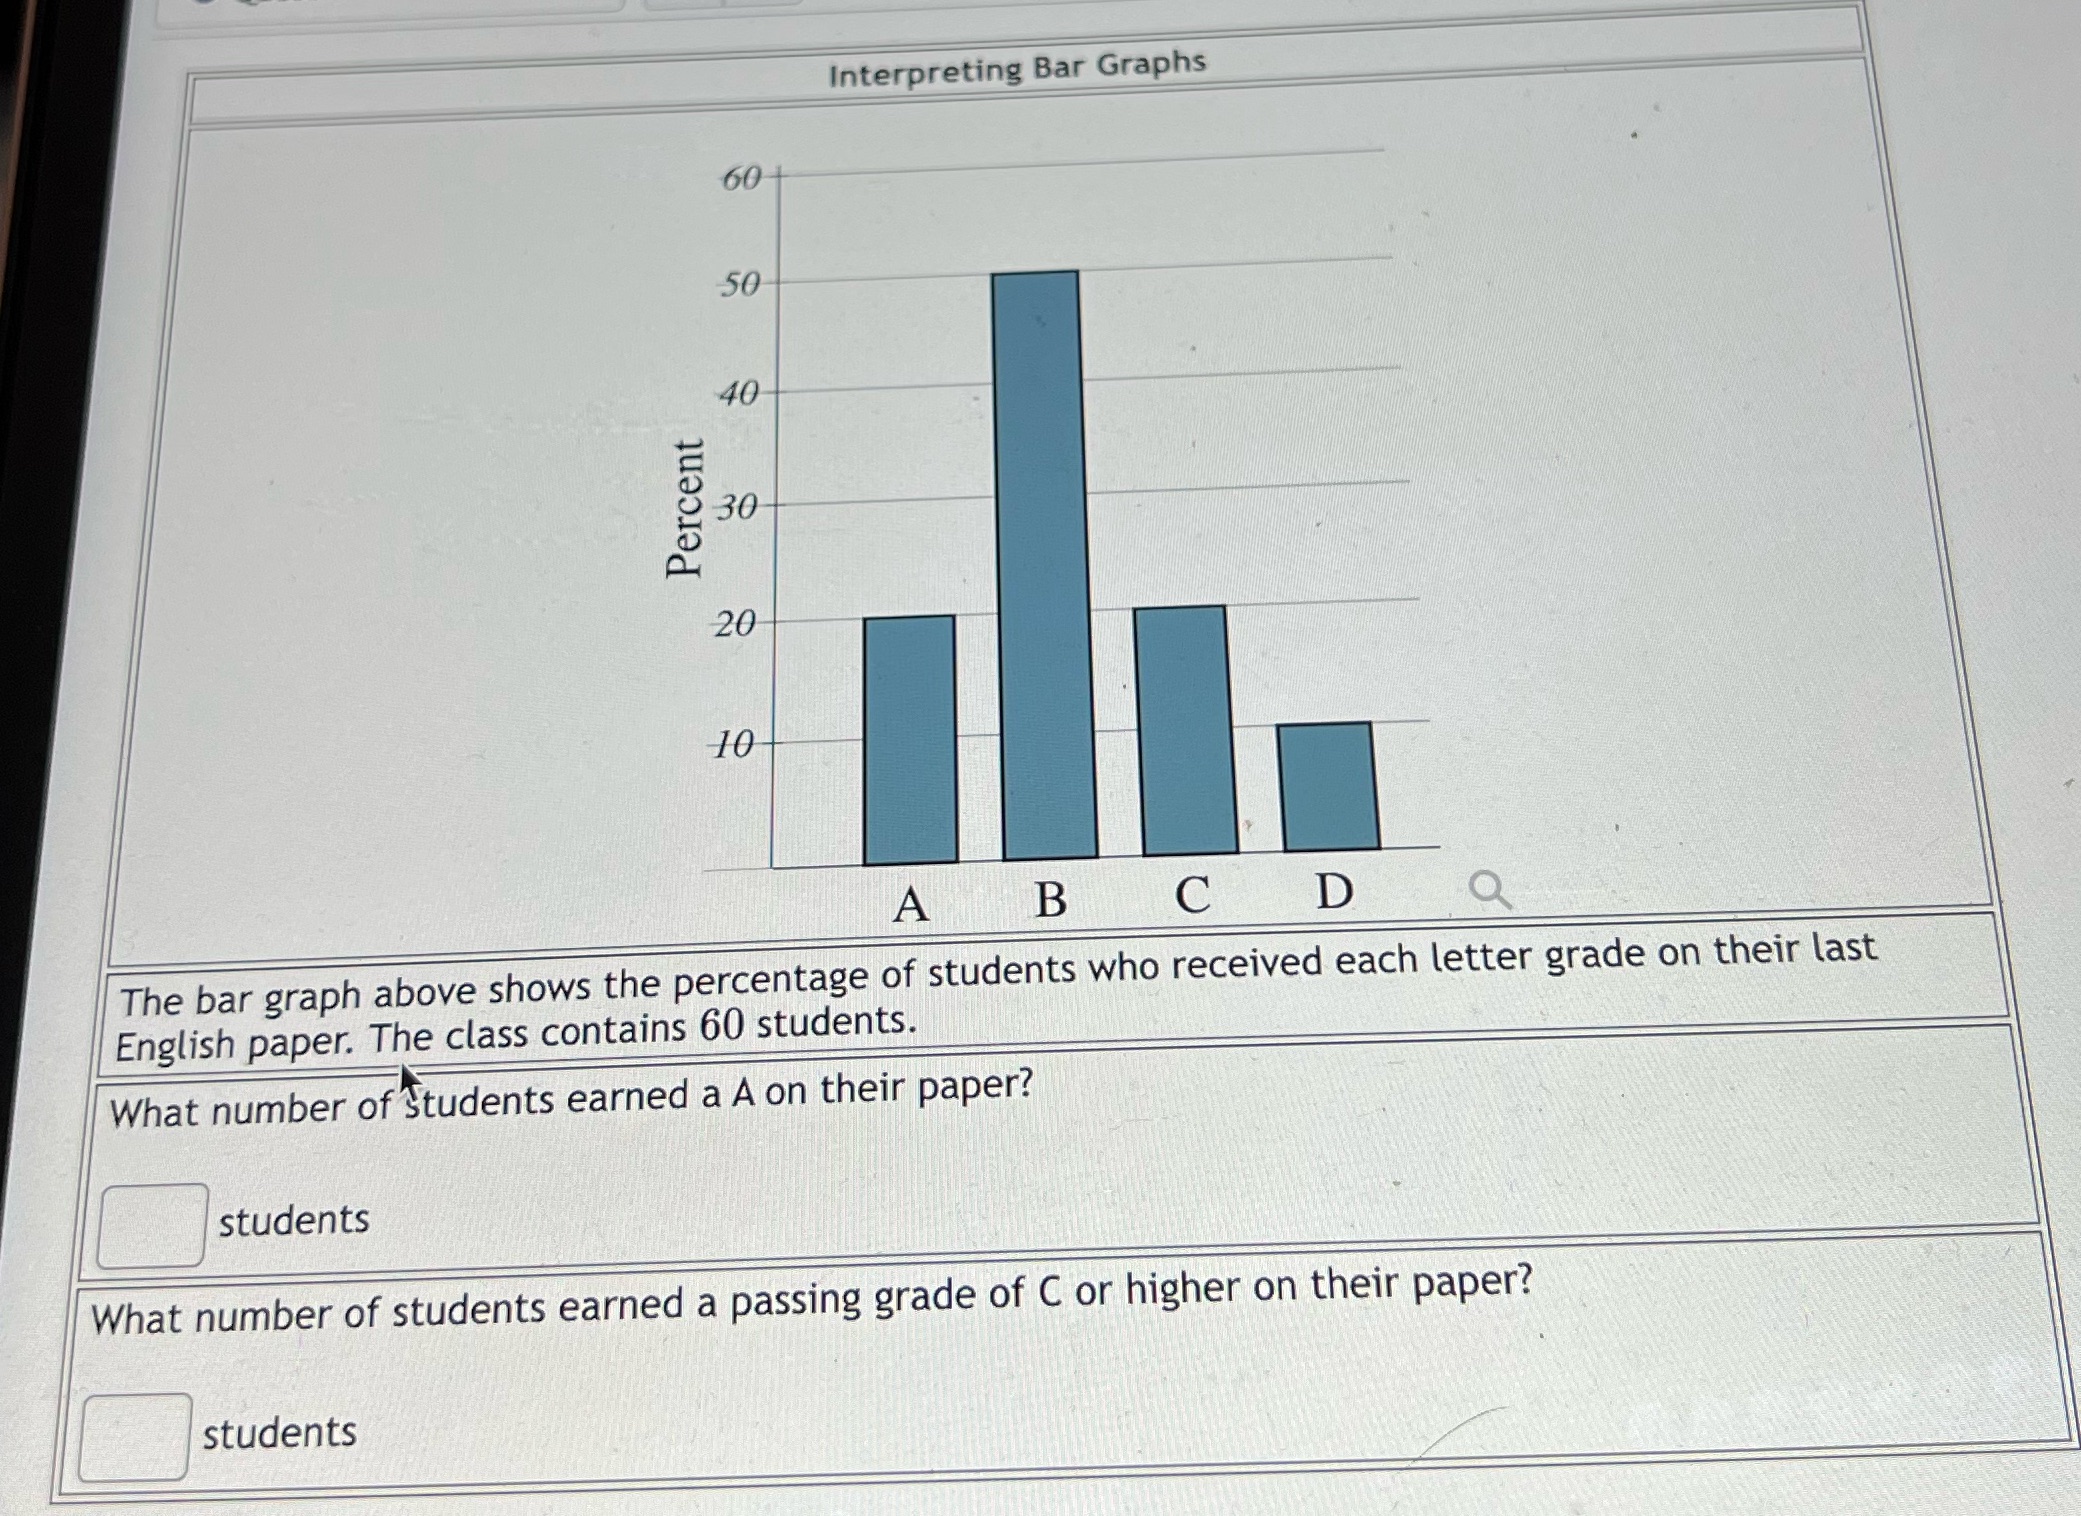
/\":\\ Interpreting Bar Graphs v' The bar graph above shows the percentage of students who received each letter grade on their test English paper. The class contains 60 students. What number of gtudents earned a A on their paper? [3 students What number of students r_\\ f students earned a passing grade of C or higher on their paper
Step by Step Solution
There are 3 Steps involved in it
1 Expert Approved Answer
Step: 1 Unlock

Question Has Been Solved by an Expert!
Get step-by-step solutions from verified subject matter experts
Step: 2 Unlock
Step: 3 Unlock