

Interpreting plots Bar chart showing the proportion of cars of each color, bymanufacturer: A luxury car dealership
Fantastic news! We've Found the answer you've been seeking!
Question:
Interpreting plots
Bar chart showing the proportion of cars of each color, bymanufacturer:
A luxury car dealership sells cars from four manufacturers(Ferrari, Jaguar, Lamborghini, and Mercedes) in four colors (green,red, silver, and yellow). Below is a bar chart showing theproportion of cars of each color, by manufacturer.
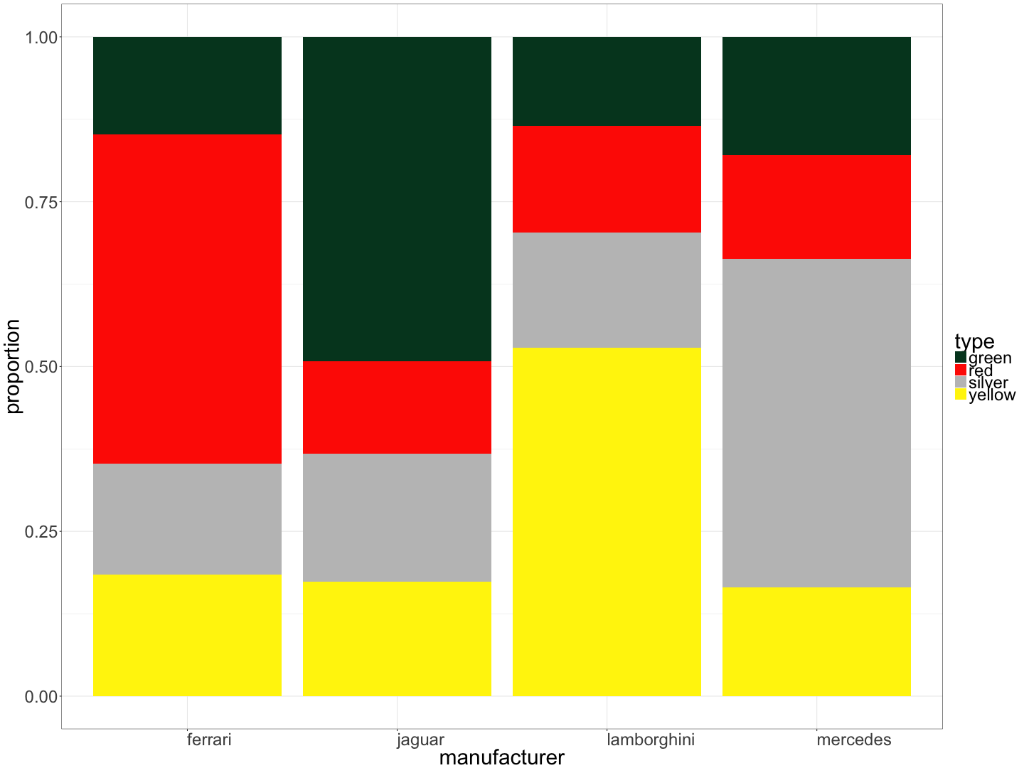
Which manufacturer has the second highest proportion of carsthat are silver?
A. Mercedes.B. Jaguar. C. Lamborghini.D. Ferrari.
Which manufacturer has the lowest proportion of cars that aregreen?
A. Mercedes.B. Jaguar.C. Lamborghini. D. Ferrari.
Expert Answer:
The detailed answer for the above question is provided below A Answer 1 B Jagua... View the full answer

Related Book For 

Business Statistics For Contemporary Decision Making
ISBN: 978-1118749647
8th edition
Authors: Black Ken
Posted Date:
