

Question: Interpreting Results: Practice Assignment Instructions: Look at each SPSS output and then answer the following questions. Some questions have multiple parts, so be sure to
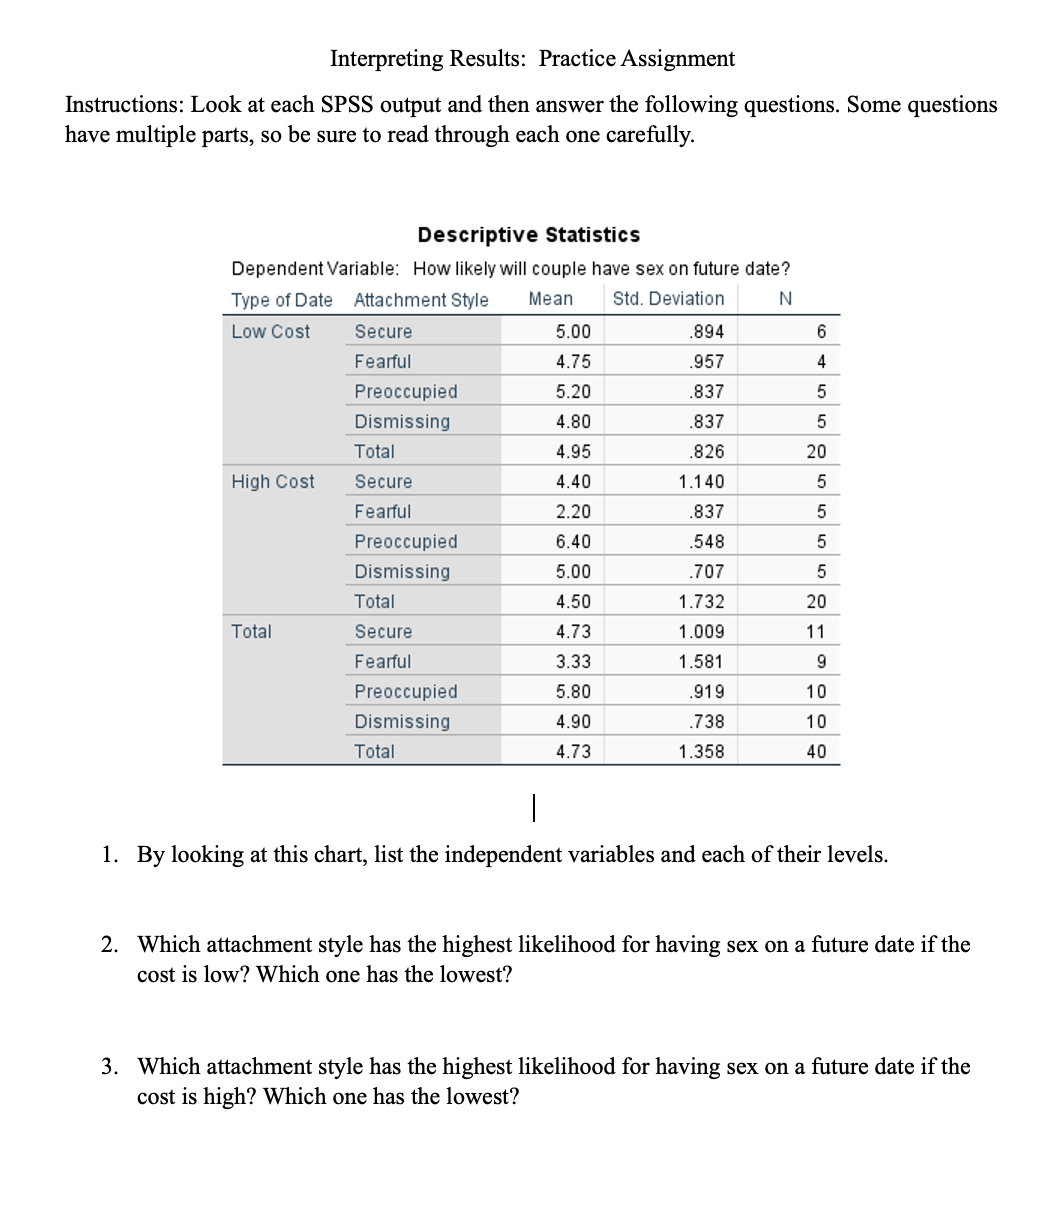
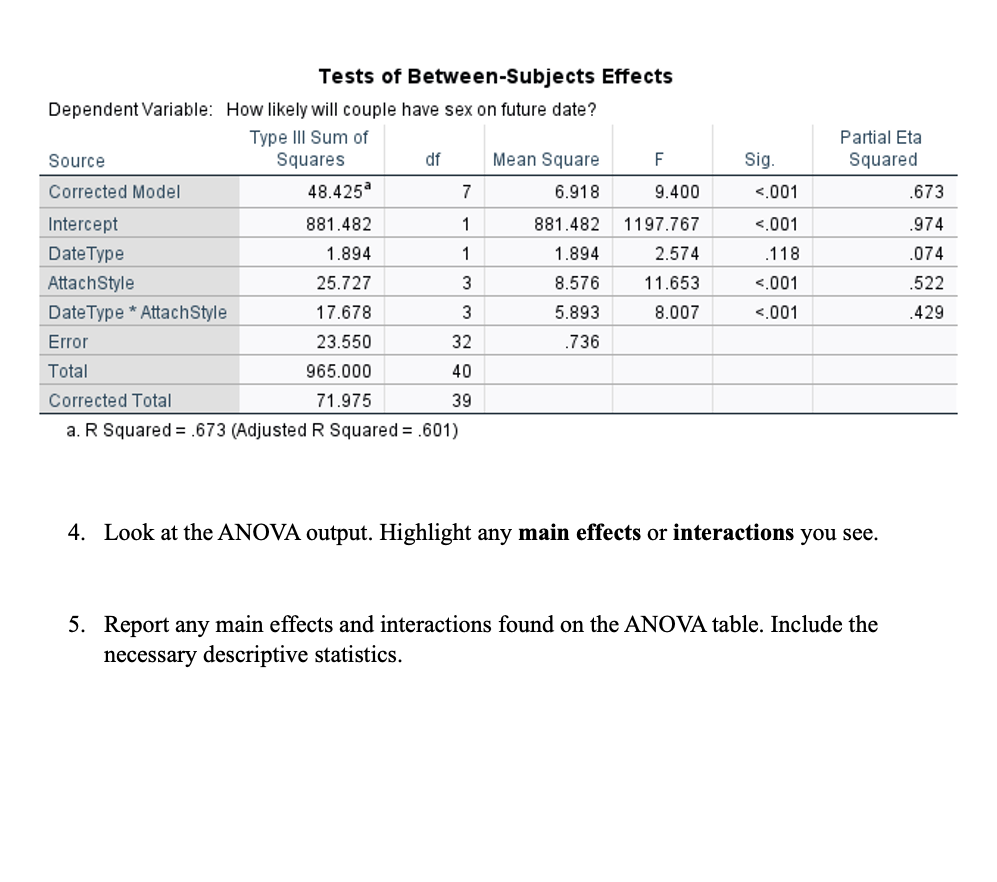
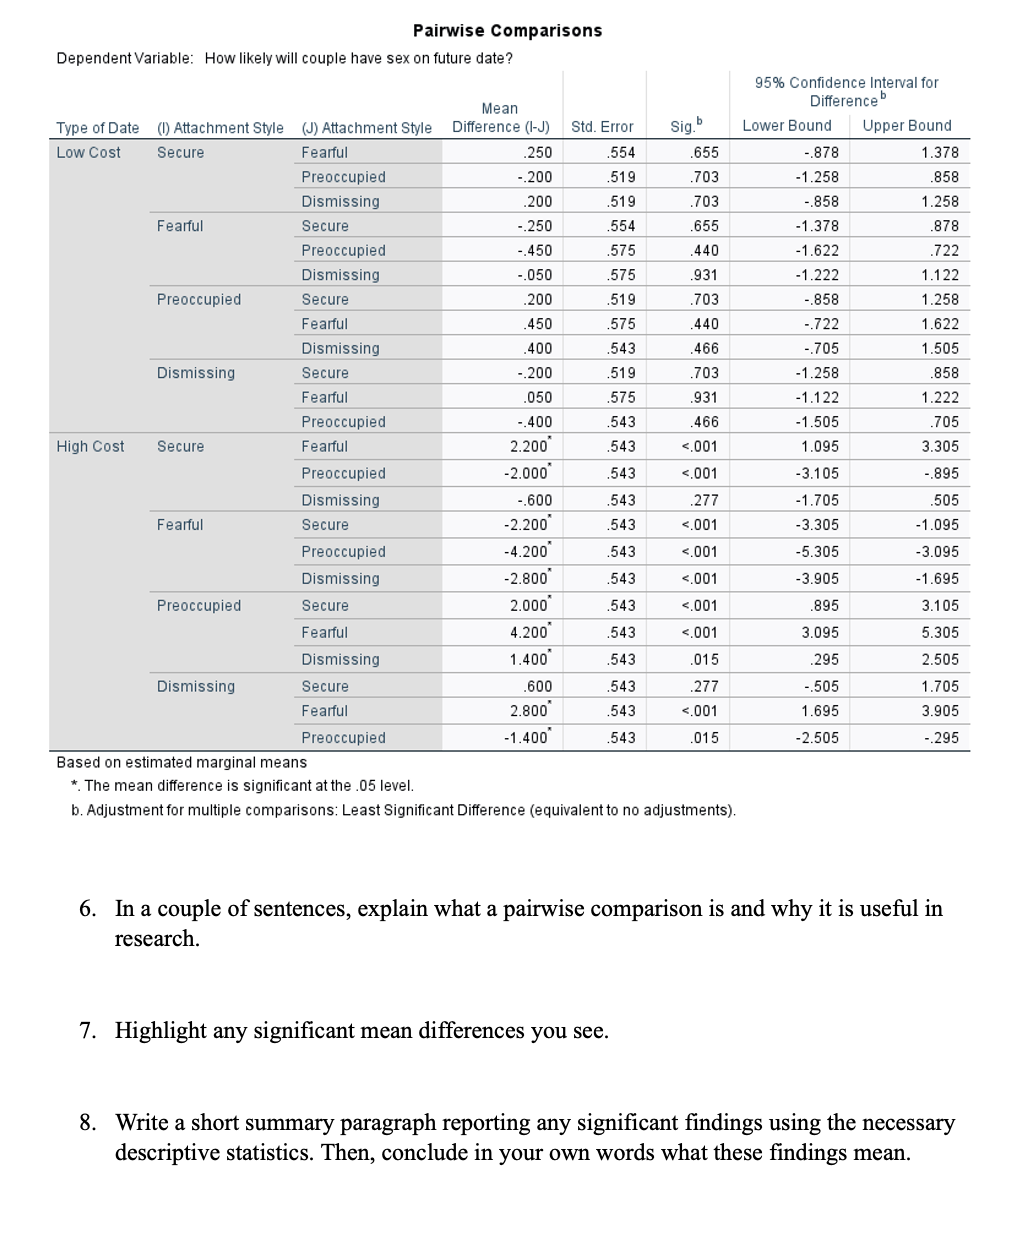
Interpreting Results: Practice Assignment Instructions: Look at each SPSS output and then answer the following questions. Some questions have multiple parts, so be sure to read through each one carefully. Descriptive Statistics Dependent Variable: How likely will couple have sex on future date? Type of Date Attachment Style Mean Std. Deviation N Low Cost Secure 5.00 894 6 Fearful 4.75 957 4 Preoccupied 5.20 837 5 Dismissing 4.80 837 5 Total 4.95 826 20 High Cost Secure 4.40 1.140 5 Fearful 2.20 837 5 Preoccupied 6.40 .548 5 Dismissing 5.00 .707 5 Total 4.50 1.732 20 Total Secure 4.73 1.009 11 Fearful 3.33 1.581 9 Preoccupied 5.80 919 10 Dismissing 4.90 .738 10 Total 4.73 1.358 40 1. By looking at this chart, list the independent variables and each of their levels. 2. Which attachment style has the highest likelihood for having sex on a future date if the cost is low? Which one has the lowest? 3. Which attachment style has the highest likelihood for having sex on a future date if the cost is high? Which one has the lowest?Tests of Between-Subjects Effects Dependent Variable: How likely will couple have sex on future date? Type Ill Sum of Partial Eta Source Squares df Mean Square F Sig Squared Corrected Model 48.425 7 6.918 9.400 <.001 intercept date type .118 attachstyle error .736 total corrected a. r squared=".673" look at the anova output. highlight any main effects or interactions you see. report and found on table. include necessary descriptive statistics.pairwise comparisons dependent variable: how likely will couple have sex future confidence interval for difference mean of attachment style std. sig. b lower bound upper low cost secure fearful preoccupied .200 dismissing .250 .050 .705 high .543 .895 .600 .505 .001 .3.095 .295 based estimated marginal means is significant .05 level. b. adjustment multiple comparisons: least to no adjustments in a sentences explain what pairwise comparison why it useful research. differences write short summary paragraph reporting findings using statistics. then conclude your own words these>
Step by Step Solution
There are 3 Steps involved in it

Get step-by-step solutions from verified subject matter experts