

Question: Interval 0 Interval Change in .f(x) Change in g() Change in h(x) Change in k(c) 2.1 2.1 2.1 2.1 2.0 3.2 2.0 3.2 2.1 4.2

Interval 0
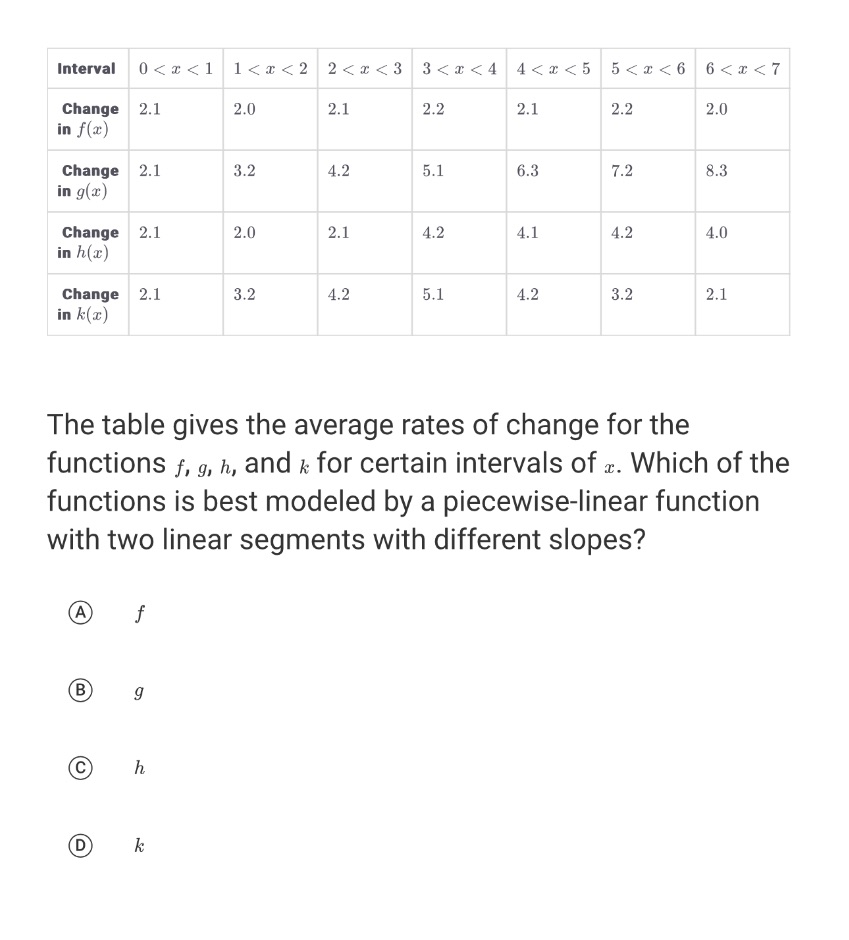
Interval Change in .f(x) Change in g() Change in h(x) Change in k(c) 2.1 2.1 2.1 2.1 2.0 3.2 2.0 3.2 2.1 4.2 2.1 4.2 2.2 5.1 4.2 5.1 2.1 6.3 4.1 4.2 2.2 7.2 4.2 3.2 2.0 8.3 4.0 2.1 The table gives the average rates of change for the functions f, g, h, and k for certain intervals of x. Which of the functions is best modeled by a piecewise-linear function with two linear segments with different slopes?
Step by Step Solution
There are 3 Steps involved in it
1 Expert Approved Answer
Step: 1 Unlock

Question Has Been Solved by an Expert!
Get step-by-step solutions from verified subject matter experts
Step: 2 Unlock
Step: 3 Unlock