

Question: Intro to Statistics,Question 1, Part a,b,c Fitting a simple linear regression model to this dataset using R, the The following scatter plot describes the linear
Intro to Statistics,Question 1, Part a,b,c
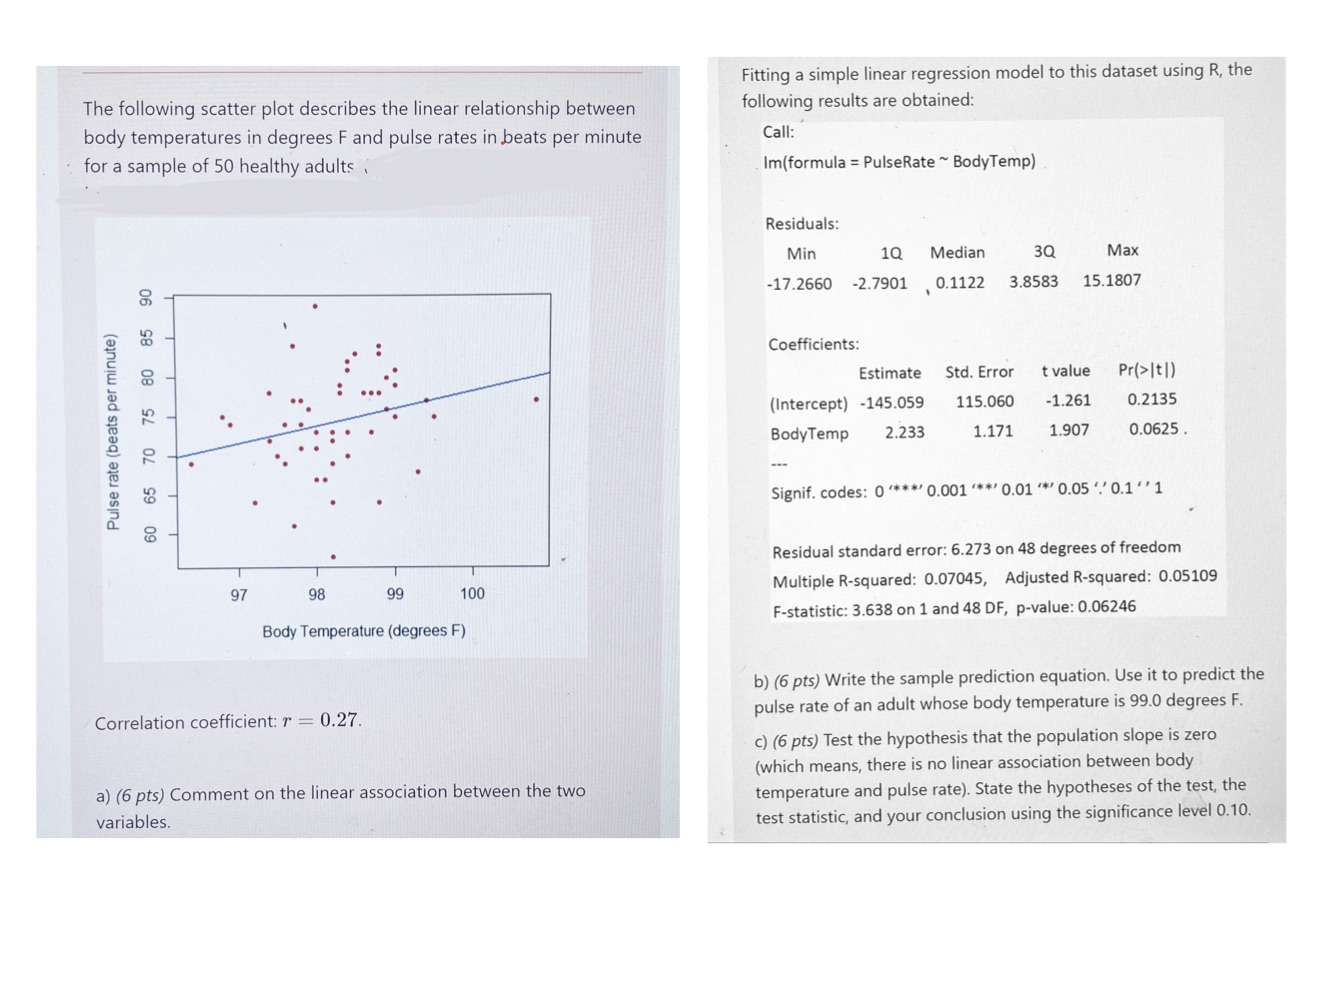
Fitting a simple linear regression model to this dataset using R, the The following scatter plot describes the linear relationship between following results are obtained: body temperatures in degrees F and pulse rates in beats per minute Call: for a sample of 50 healthy adults Im(formula = PulseRate ~ BodyTemp) Residuals: Min 1Q 30 Max -17.2660 -2.7901 0.1122 3.8583 15.1807 90 Coefficients: Estimate Std. Error t value Pr(> It1) (Intercept) -145.059 115.060 -1.261 0.2135 Pulse rate (beats per minute) 60 65 70 75 80 85 BodyTemp 2.233 1.171 1.907 0.0625 . Signif. codes: 0 "***0.001 "**0.01 ' 0.05 '' 0.1"' 1 Residual standard error: 6.273 on 48 degrees of freedom 97 98 99 100 Multiple R-squared: 0.07045, Adjusted R-squared: 0.05109 F-statistic: 3.638 on 1 and 48 DF, p-value: 0.06246 Body Temperature (degrees F) b) (6 pts) Write the sample prediction equation. Use it to predict the Correlation coefficient: r = 0.27. pulse rate of an adult whose body temperature is 99.0 degrees F. c) (6 pts) Test the hypothesis that the population slope is zero (which means, there is no linear association between body a) (6 pts) Comment on the linear association between the two temperature and pulse rate). State the hypotheses of the test, the variables. test statistic, and your conclusion using the significance level 0.10
Step by Step Solution
There are 3 Steps involved in it

Get step-by-step solutions from verified subject matter experts