

Question: Introduction As you work towards your final team project, there are sections of the project that will require individual work. Using the feedback from the
Introduction
As you work towards your final team project, there are sections of the project that will require individual work. Using the feedback from the PayPal ratios assignment in Unit 2, individually (not as a team) you will use the attached MS Excel file to create your ratios for your final project. Using this file gather and report your ratio and financial performance data for Mastercard for 2017 - 2019. Within the Mastercard Financial Ratios MS Excel file you will find four sheets; ratios, income statement, balance sheet, cash flow. Using the accounting statements, you will use MS Excel to calculate the ratios and enter into the ratios sheet.
Directions
- Place your ratio calculations in the MS Excel table template for Mastercard for 2017 -2019.
- Provide the formula used to calculate each ratio in the column to the right of your calculations. For example, for calculating the Gross Margin for a company, you would enter Gross Profit / Sales (gross profit divided by sales).
- When calculating values, you should use the SUM function in MS Excel and reference the values directly from the accounting statements provided. Attached you will find an example for PayPal and the calculations for Gross Margin and Operating Margin using MS Excel SUM function.
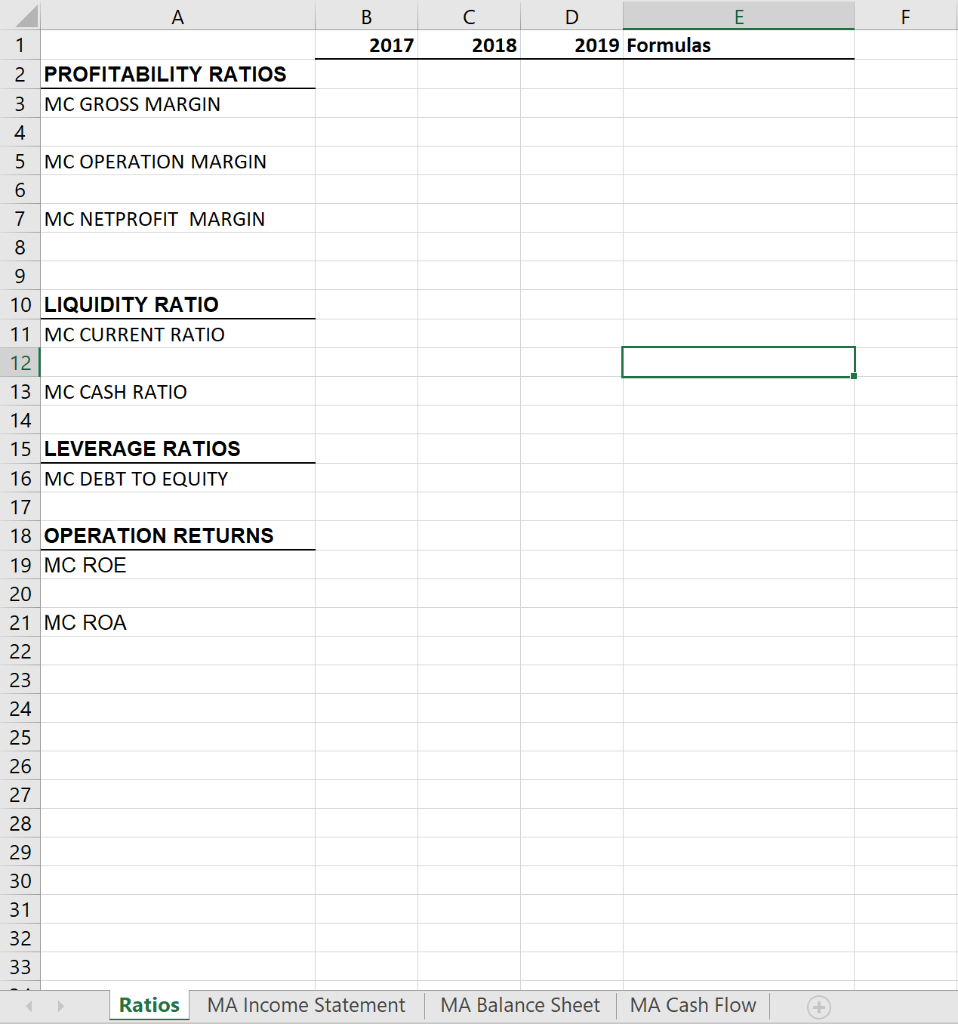
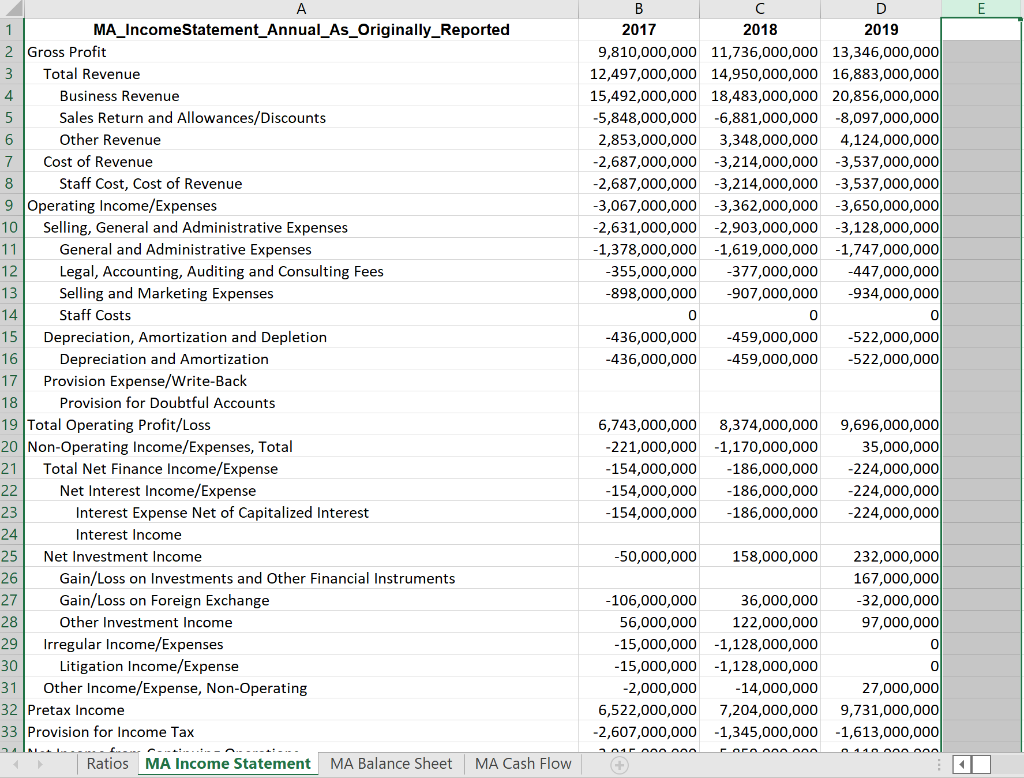
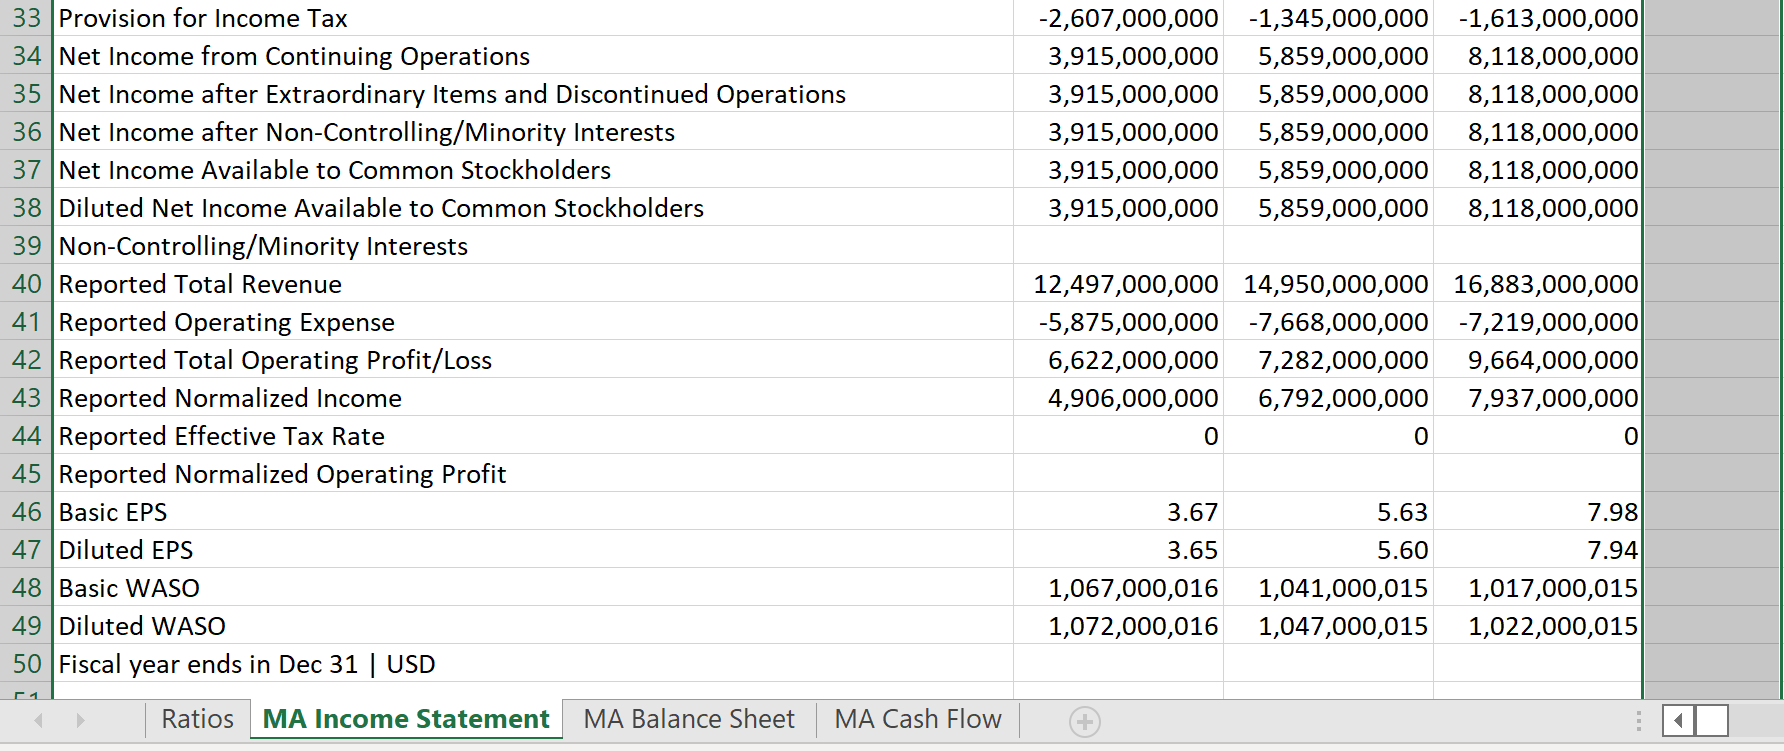
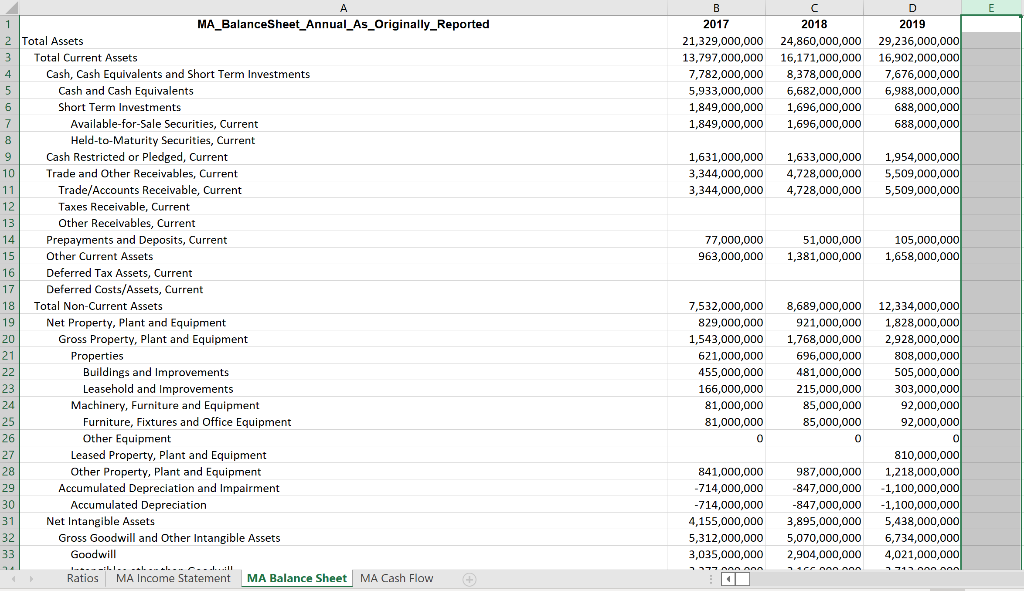
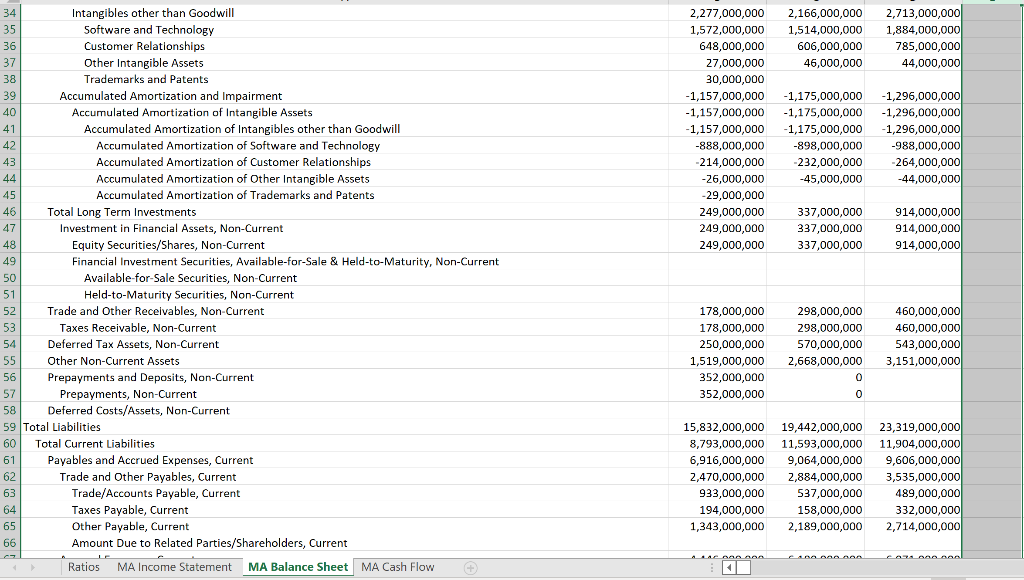
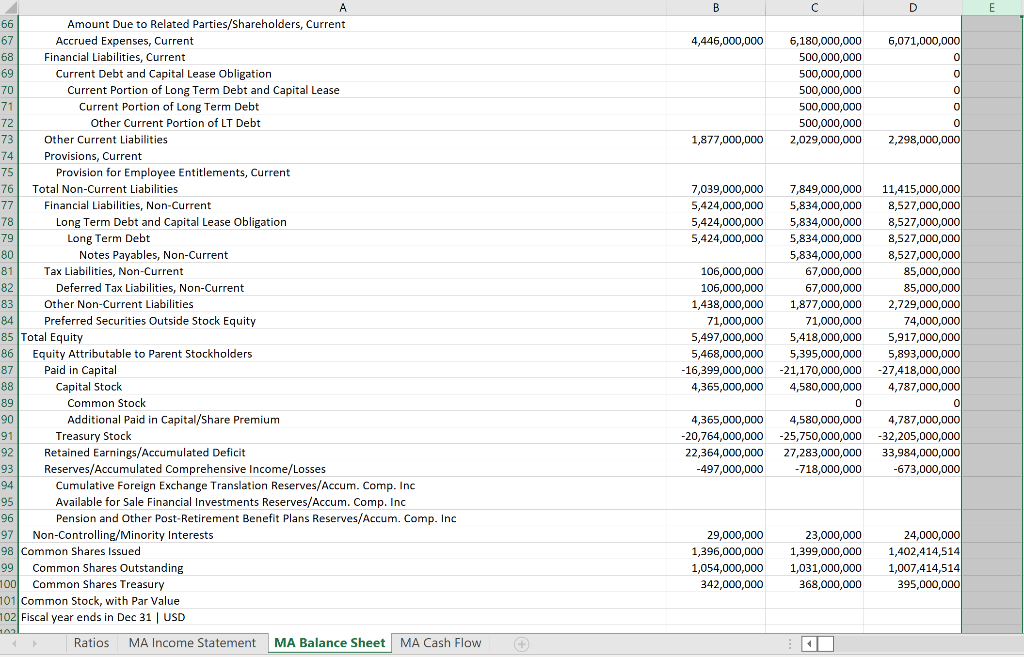
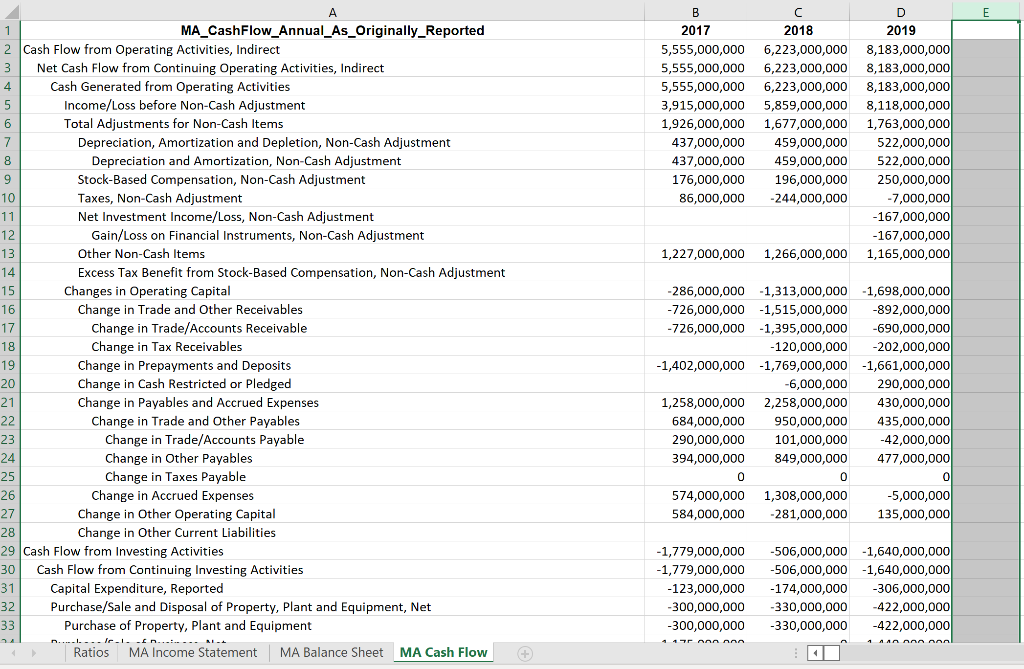
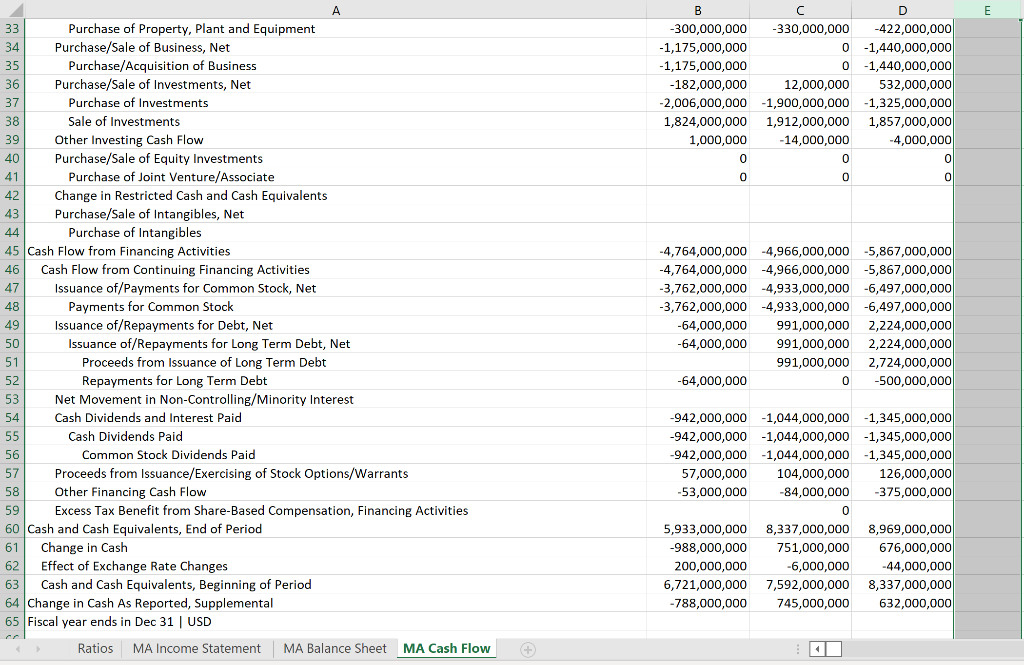
B E F 2018 D 2019 Formulas 2017 A 1 2 PROFITABILITY RATIOS 3 MC GROSS MARGIN 4 5 MC OPERATION MARGIN 6 7 MC NETPROFIT MARGIN 8 9 10 LIQUIDITY RATIO 11 MC CURRENT RATIO 12 13 MC CASH RATIO 14 15 LEVERAGE RATIOS 16 MC DEBT TO EQUITY 17 18 OPERATION RETURNS 19 MC ROE 20 21 MC ROA 22 23 24 25 26 27 28 29 30 31 32 33 Ratios MA Income Statement MA Balance Sheet MA Cash Flow E B D 2017 2018 2019 9,810,000,000 11,736,000,000 13,346,000,000 12,497,000,000 14,950,000,000 16,883,000,000 15,492,000,000 18,483,000,000 20,856,000,000 -5,848,000,000 -6,881,000,000 -8,097,000,000 2,853,000,000 3,348,000,000 4,124,000,000 -2,687,000,000 -3,214,000,000 3,537,000,000 -2,687,000,000 3,214,000,000 -3,537,000,000 -3,067,000,000 3,362,000,000 3,650,000,000 -2,631,000,000 -2,903,000,000 -3,128,000,000 -1,378,000,000 -1,619,000,000 -1,747,000,000 -355,000,000 -377,000,000 -447,000,000 -898,000,000 -907,000,000 -934,000,000 0 0 0 -436,000,000 -459,000,000 -522,000,000 -436,000,000 -459,000,000 -522,000,000 A 1 MA_Income Statement_Annual_As_Originally_Reported 2 Gross Profit Total Revenue 4 Business Revenue 5 Sales Return and Allowances/Discounts 6 Other Revenue 7 Cost of Revenue 8 Staff Cost, Cost of Revenue 9 Operating Income/Expenses 10 Selling, General and Administrative Expenses 11 General and Administrative Expenses 12 Legal, Accounting, Auditing and Consulting Fees 13 Selling and Marketing Expenses 14 Staff Costs 15 Depreciation, Amortization and Depletion 16 Depreciation and Amortization 17 Provision Expense/Write-Back 18 Provision for Doubtful Accounts 19 Total Operating Profit/Loss 20 Non-Operating Income/Expenses, Total 21 Total Net Finance Income/Expense 22 Net Interest Income/Expense 23 Interest Expense Net of Capitalized Interest 24 Interest Income 25 Net Investment Income 26 Gain/Loss on Investments and Other Financial Instruments 27 Gain/Loss on Foreign Exchange 28 Other Investment Income 29 Irregular Income/Expenses 30 Litigation Income/Expense 31 Other Income/Expense, Non-Operating 32 Pretax Income 33 Provision for Income Tax 6,743,000,000 -221,000,000 -154,000,000 -154,000,000 -154,000,000 8,374,000,000 -1,170,000,000 -186,000,000 -186,000,000 -186,000,000 9,696,000,000 35,000,000 -224,000,000 -224,000,000 -224,000,000 -50,000,000 158,000,000 232,000,000 167,000,000 -106,000,000 36,000,000 -32,000,000 56,000,000 122,000,000 97,000,000 -15,000,000 -1,128,000,000 0 -15,000,000 -1,128,000,000 0 -2,000,000 -14,000,000 27,000,000 6,522,000,000 7,204,000,000 9,731,000,000 -2,607,000,000 -1,345,000,000 -1,613,000,000 101 000 000 + ----------- POLO Ratios MA Income Statement MA Balance Sheet MA Cash Flow -2,607,000,000 -1,345,000,000 -1,613,000,000 3,915,000,000 5,859,000,000 8,118,000,000 3,915,000,000 5,859,000,000 8,118,000,000 3,915,000,000 5,859,000,000 8,118,000,000 3,915,000,000 5,859,000,000 8,118,000,000 3,915,000,000 5,859,000,000 8,118,000,000 33 Provision for Income Tax 34 Net Income from Continuing Operations 35 Net Income after Extraordinary Items and Discontinued Operations 36 Net Income after Non-Controlling/Minority Interests 37 Net Income Available to Common Stockholders 38 Diluted Net Income Available to Common Stockholders 39 Non-Controlling/Minority Interests 40 Reported Total Revenue 41 Reported Operating Expense 42 Reported Total Operating Profit/Loss 43 Reported Normalized Income 44 Reported Effective Tax Rate 45 Reported Normalized Operating Profit 46 Basic EPS 47 Diluted EPS 48 Basic WASO 49 Diluted WASO 50 Fiscal year ends in Dec 31 | USD 12,497,000,000 14,950,000,000 16,883,000,000 -5,875,000,000 -7,668,000,000 -7,219,000,000 6,622,000,000 7,282,000,000 9,664,000,000 4,906,000,000 6,792,000,000 7,937,000,000 0 0 0 3.67 3.65 1,067,000,016 1,072,000,016 5.63 5.60 1,041,000,015 1,047,000,015 7.98 7.94 1,017,000,015 1,022,000,015 1. Ratios MA Income Statement MA Balance Sheet MA Cash Flow 2017 21,329,000,000 13,797,000,000 7,782,000,000 5,933,000,000 1,849,000,000 1,849,000,000 D 2018 2019 24,860,000,000 29,236,000,000 16,171,000,000 16,902,000,000 8,378,000,000 7,676,000,000 6,682,000,000 6,988,000,000 1,696,000,000 688,000,000 1,696,000,000 688,000,000 1,631,000,000 3,344,000,000 3,344,000,000 1,633,000,000 4,728,000,000 4,728,000,000 1,954,000,000 5,509,000,000 5,509,000,000 77,000,000 963,000,000 51,000,000 1,381,000,000 105,000,000 1,658,000,000 A 1 MA_Balance Sheet_Annual_As_Originally_Reported 2 Total Assets 3 Total Current Assets 4. Cash, Cash Equivalents and Short Term Investments 5 Cash and Cash Equivalents 6 Short Term Investments 7 Available-for-Sale Securities, Current 8 8 Held-to-Maturity Securities, Current 9 Cash Restricted or Pledged, Current 10 Trade and Other Receivables, Current 11 Trade/Accounts Receivable, Current 12 Taxes Receivable, Current 13 Other Receivables, Current 14 14 Prepayments and Deposits, Current 15 Other Current Assets 16 Deferred Tax Assets, Current 17 17 Deferred Costs/Assets, Current 18 Total Non-Current Assets 10 19 Net Property, Plant and Equipment 20 Gross Property, plant and Equipment 21 Properties Buildin 22 Buildings and improvements 23 Leasehold and Improvements 24 Machinery, Furniture and Equipment 25 Furniture, Fixtures and Office Equipment 26 Other Equipment 27 Leased Property, plant and Equipment 28 Other Property, Plant and Equipment 29 Accumulated Depreciation and Impairment 30 Accumulated Depreciation 31 Net Intangible Assets 32 Gross Goodwill and Other Intangible Assets 33 Goodwill ---LI. --------...!! Ratios MA Income Statement MA Balance Sheet MA Cash Flow 7,532,000,000 829,000,000 1,543,000,000 621,000,000 455,000,000 166,000,000 81,000,000 81,000,000 0 8,689,000,000 921,000,000 1,768,000,000 696,000,000 481,000,000 215,000,000 85,000,000 85,000,000 0 12,334,000,000 1,828,000,000 2,928,000,000 808,000,000 505,000,000 303,000,000 92,000,000 92,000,000 0 810,000,000 1,218,000,000 -1,100,000,000 -1,100,000,000 5,438,000,000 6,734,000,000 4,021,000,000 74 Annon 841,000,000 -714,000,000 -714,000,000 4,155,000,000 5,312,000,000 3,035,000,000 987,000,000 -847,000,000 -847,000,000 3,895,000,000 5,070,000,000 2,904,000,000 CF AAA ANA 2,277,000,000 2,166,000,000 2,713,000,000 1,572,000,000 1,514,000,000 1,884,000,000 648,000,000 606,000,000 785,000,000 27,000,000 46,000,000 44,000,000 30,000,000 -1,157,000,000 -1,175,000,000 -1,296,000,000 -1,157,000,000 -1,175,000,000 -1,296,000,000 -1,157,000,000 -1,175,000,000 -1,296,000,000 -888,000,000 -898,000,000 -988,000,000 -214,000,000 -232,000,000 -264,000,000 -26,000,000 -45,000,000 -44,000,000 -29,000,000 249,000,000 337,000,000 914,000,000 249,000,000 337,000,000 914,000,000 249,000,000 337,000,000 914,000,000 34 Intangibles other than Goodwill 35 Software and Technology 36 Customer Relationships 37 Other Intangible Assets 38 Trademarks and Patents and ralen 39 Accumulated Amortization and Impairment 40 Accumulated Amortization of Intangible Assets 41 Accumulated Amortization of Intangibles other than Goodwill 22 42 Accumulated Amortization of Software and Technology 43 Accumulated Amortization of Customer Relationships 44 Accumulated Amortization of Other Intangible Assets 45 Accumulated Amortization of Trademarks and Patents 46 Total Long Term Investments 47 Investment in Financial Assets, Non-Current 48 Equity Securities/Shares, Non-Current 49 Financial Investment Securities, Available-for-Sale & Held-to-Maturity, Non-Current 50 Available-for-Sale Securities, Non-Current 51 Held-to-Maturity Securities, Non-Current 52 Trade and Other Receivables, Non-Current 53 Taxes Receivable, Non-Current 54 Deferred Tax Assets, Non-Current 55 Other Non-Current Assets 56 Prepayments and Deposits, Non-Current 57 Prepayments, Non-Current 58 Deferred Costs/Assets, Non-Current 59 Total Liabilities 60 Total Current Liabilities 61 Payables and Accrued Expenses, Current 62 Trade and Other Payables, Current 63 Trade/Accounts Payable, Current 64 Taxes Payable, Current 65 Other Payable, Current 66 Amount Due to Related Parties/Shareholders, Current 178,000,000 178,000,000 250,000,000 1,519,000,000 352,000,000 352,000,000 298,000,000 298,000,000 570,000,000 2,668,000,000 0 0 460,000,000 460,000,000 543,000,000 3,151,000,000 15,832,000,000 8,793,000,000 6,916,000,000 2,470,000,000 933,000,000 194,000,000 1,343,000,000 19,442,000,000 23,319,000,000 11,593,000,000 11,904,000,000 9,064,000,000 9,606,000,000 2,884,000,000 3,535,000,000 537,000,000 489,000,000 158,000,000 332,000,000 2,189,000,000 2,714,000,000 - Mahaa CARA DA Ratios MA Income Statement MA Balance Sheet MA Cash Flow MC Don Ann : + B D E 66 67 4,446,000,000 68 6,071,000,000 0 o 6,180,000,000 500,000,000 500,000,000 500,000,000 500,000,000 500,000,000 2,029,000,000 0 0 0 2,298,000,000 1,877,000,000 69 70 71 72 73 74 75 76 77 78 79 80 81 82 02 83 85 84 84 A Amount Due to Related Parties/Shareholders, Current Accrued Expenses, Current Financial Liabilities, Current Current Debt and Capital Lease Obligation Current Portion of Long Term Debt and Capital Lease Current Portion of Long Term Debt Other Current Portion of LT Debt Other Current Liabilities Provisions, Current Provision for Employee Entitlements, Current Total Non-Current Liabilities Financial Liabilities, Non-Current Long Term Debt and Capital Lease Obligation Long Term Debt Notes Payables, Non-Current Tax Liabilities, Non-Current Deferred Tax Liabilities, Non-Current Other Non-Current Liabilities Preferred Securities Outside Stock Equity 85 Total Equity 7,039,000,000 7,849,000,000 11,415,000,000 5,424,000,000 5,834,000,000 8,527,000,000 5,424,000,000 5,834,000,000 8,527,000,000 5,424,000,000 5,834,000,000 8,527,000,000 5,834,000,000 8,527,000,000 106,000,000 67,000,000 85,000,000 106,000,000 67,000,000 85,000,000 1,438,000,000 1,877,000,000 2,729,000,000 71,000,000 71,000,000 74,000,000 5,497,000,000 5,418,000,000 5,917,000,000 5,468,000,000 5,395,000,000 5,893,000,000 -16,399,000,000 -21,170,000,000 -27,418,000,000 4,365,000,000 4,580,000,000 4,787,000,000 0 0 4,365,000,000 4,580,000,000 4,787,000,000 -20,764,000,000 -25,750,000,000 -32,205,000,000 22,364,000,000 27,283,000,000 33,984,000,000 -497,000,000 -718,000,000 -673,000,000 88 86 Equity Attributable to Parent Stockholders -- 87 Paid in Capital o Capital Stock 89 Common Stock 90 Additional Paid in Capital/Share Premium . 91 Treasury Stock 92 Retained Earnings/Accumulated Deficit 93 Reserves/Accumulated Comprehensive Income/Losses 941 Cumulative Foreign Exchange Translation Reserves/Accum. Comp. Inc 95 Available for Sale Financial Investments Reserves/Accum. Comp. Inc 96 Pension and Other Post-Retirement Benefit Plans Reserves/Accum. Comp. Inc 97 Non-Controlling/Minority Interests 98 Common Shares Issued 99 Common Shares Outstanding 100 Common Shares Treasury 101 Common Stock, with Par Value 102 Fiscal year ends in Dec 31 USD Ratios MA Income Statement MA Balance Sheet MA Cash Flow 29,000,000 1,396,000,000 1,054,000,000 342,000,000 23,000,000 1,399,000,000 1,031,000,000 368,000,000 24,000,000 1,402,414,514 1,007,414,514 395,000,000 E B 2017 5,555,000,000 5,555,000,000 5,555,000,000 3,915,000,000 1,926,000,000 437,000,000 437,000,000 176,000,000 86,000,000 C 2018 6,223,000,000 6,223,000,000 6,223,000,000 5,859,000,000 1,677,000,000 459,000,000 459,000,000 196,000,000 -244,000,000 D 2019 8,183,000,000 8,183,000,000 8,183,000,000 8,118,000,000 1,763,000,000 522,000,000 522,000,000 250,000,000 -7,000,000 -167,000,000 -167,000,000 1,165,000,000 1,227,000,000 1,266,000,000 A MA_CashFlow_Annual_As_Originally_Reported 2 Cash Flow from Operating Activities, Indirect 3 Net Cash Flow from Continuing Operating Activities, Indirect 4 Cash Generated from Operating Activities 5 Income/Loss before Non-Cash Adjustment 6 Total Adjustments for Non-Cash Items 7 Depreciation, Amortization and Depletion, Non-Cash Adjustment 8 Depreciation and Amortization, Non-Cash Adjustment 9 Stock-Based Compensation, Non-Cash Adjustment 10 Taxes, Non-Cash Adjustment 11 Net Investment Income/Loss, Non-Cash Adjustment 12 Gain/Loss on Financial Instruments, Non-Cash Adjustment 13 Other Non-Cash Items 14 Excess Tax Benefit from Stock-Based Compensation, Non-Cash Adjustment 15 Changes in Operating Capital 16 Change in Trade and Other Receivables 17 Change in Trade/Accounts Receivable 18 Change in Tax Receivables 19 Change in Prepayments and Deposits 20 Change in Cash Restricted or Pledged 21 Change in Payables and Accrued Expenses 22 Change in Trade and Other Payables 23 Change in Trade/Accounts Payable 24 Change in Other Payables 25 Change in Taxes Payable 26 Change in Accrued Expenses 27 Change in Other Operating Capital 28 Change in Other Current Liabilities 29 Cash Flow from Investing Activities 30 Cash Flow from Continuing Investing Activities 31 Capital Expenditure, Reported 32 Purchase/Sale and Disposal of Property, Plant and Equipment, Net 33 Purchase of Property, plant and Equipment C.AL Ratios MA Income Statement MA Balance Sheet MA Cash Flow -286,000,000 -726,000,000 -726,000,000 -1,402,000,000 -1,313,000,000 -1,515,000,000 -1,395,000,000 -120,000,000 -1,769,000,000 -6,000,000 2,258,000,000 950,000,000 101,000,000 849,000,000 0 1,308,000,000 -281,000,000 -1,698,000,000 -892,000,000 -690,000,000 -202,000,000 -1,661,000,000 290,000,000 430,000,000 435,000,000 -42,000,000 477,000,000 1,258,000,000 684,000,000 290,000,000 394,000,000 574,000,000 584,000,000 -5,000,000 135,000,000 -1,779,000,000 -1,779,000,000 -123,000,000 -300,000,000 -300,000,000 -506,000,000 -506,000,000 -174,000,000 -330,000,000 -330,000,000 -1,640,000,000 -1,640,000,000 -306,000,000 -422,000,000 -422,000,000 I... Ir 14 AA AAN 1 AA AAA AAN + E B C D -300,000,000 -330,000,000 -422,000,000 -1,175,000,000 0 -1,440,000,000 -1,175,000,000 0 -1,440,000,000 -182,000,000 12,000,000 532,000,000 -2,006,000,000 -1,900,000,000 -1,325,000,000 1,824,000,000 1,912,000,000 1,857,000,000 1,000,000 -14,000,000 -4,000,000 0 0 0 0 0 0 0 A 33 Purchase of Property, Plant and Equipment 34 Purchase/Sale of Business, Net 35 Purchase/Acquisition of Business 36 Purchase/Sale of Investments, Net 37 Purchase of Investments 38 Sale of Investments 39 Other Investing Cash Flow 40 Purchase/Sale of Equity Investments 41 Purchase of Joint Venture/Associate 42 Change in Restricted Cash and Cash Equivalents 43 Purchase/Sale of Intangibles, Net 44 Purchase of Intangibles 45 Cash Flow from Financing Activities 46 Cash Flow from Continuing Financing Activities 47 Issuance of/Payments for Common Stock, Net 48 Payments for Common Stock 49 Issuance of/Repayments for Debt, Net 50 Issuance of/Repayments for Long Term Debt, Net 51 Proceeds from Issuance of Long Term Debt 52 Repayments for Long Term Debt 53 Net Movement in Non-Controlling/Minority Interest 54 Cash Dividends and Interest Paid 55 Cash Dividends Paid 56 Common Stock Dividends Paid 57 Proceeds from Issuance/Exercising of Stock Options/Warrants 58 Other Financing Cash Flow 59 Excess Tax Benefit from Share-Based Compensation, Financing Activities 60 Cash and Cash Equivalents, End of Period 61 Change in Cash 62 Effect of Exchange Rate Changes 63 Cash and Cash Equivalents, Beginning of Period 64 Change in Cash As Reported, Supplemental 65 Fiscal year ends in Dec 31 USD Ratios MA Income Statement MA Balance Sheet MA Cash Flow -4,764,000,000 -4,966,000,000 -5,867,000,000 -4,764,000,000 -4,966,000,000 -5,867,000,000 -3,762,000,000 -4,933,000,000 -6,497,000,000 -3,762,000,000 -4,933,000,000 -6,497,000,000 -64,000,000 991,000,000 2,224,000,000 -64,000,000 991,000,000 2,224,000,000 991,000,000 2,724,000,000 -64,000,000 0 0 -500,000,000 -942,000,000 -1,044,000,000 -1,345,000,000 -942,000,000 -1,044,000,000 -1,345,000,000 -942,000,000 -1,044,000,000 -1,345,000,000 57,000,000 104,000,000 126,000,000 -53,000,000 -84,000,000 -375,000,000 0 5,933,000,000 8,337,000,000 8,969,000,000 -988,000,000 751,000,000 676,000,000 200,000,000 -6,000,000 -44,000,000 6,721,000,000 7,592,000,000 8,337,000,000 -788,000,000 745,000,000 632,000,000 B E F 2018 D 2019 Formulas 2017 A 1 2 PROFITABILITY RATIOS 3 MC GROSS MARGIN 4 5 MC OPERATION MARGIN 6 7 MC NETPROFIT MARGIN 8 9 10 LIQUIDITY RATIO 11 MC CURRENT RATIO 12 13 MC CASH RATIO 14 15 LEVERAGE RATIOS 16 MC DEBT TO EQUITY 17 18 OPERATION RETURNS 19 MC ROE 20 21 MC ROA 22 23 24 25 26 27 28 29 30 31 32 33 Ratios MA Income Statement MA Balance Sheet MA Cash Flow E B D 2017 2018 2019 9,810,000,000 11,736,000,000 13,346,000,000 12,497,000,000 14,950,000,000 16,883,000,000 15,492,000,000 18,483,000,000 20,856,000,000 -5,848,000,000 -6,881,000,000 -8,097,000,000 2,853,000,000 3,348,000,000 4,124,000,000 -2,687,000,000 -3,214,000,000 3,537,000,000 -2,687,000,000 3,214,000,000 -3,537,000,000 -3,067,000,000 3,362,000,000 3,650,000,000 -2,631,000,000 -2,903,000,000 -3,128,000,000 -1,378,000,000 -1,619,000,000 -1,747,000,000 -355,000,000 -377,000,000 -447,000,000 -898,000,000 -907,000,000 -934,000,000 0 0 0 -436,000,000 -459,000,000 -522,000,000 -436,000,000 -459,000,000 -522,000,000 A 1 MA_Income Statement_Annual_As_Originally_Reported 2 Gross Profit Total Revenue 4 Business Revenue 5 Sales Return and Allowances/Discounts 6 Other Revenue 7 Cost of Revenue 8 Staff Cost, Cost of Revenue 9 Operating Income/Expenses 10 Selling, General and Administrative Expenses 11 General and Administrative Expenses 12 Legal, Accounting, Auditing and Consulting Fees 13 Selling and Marketing Expenses 14 Staff Costs 15 Depreciation, Amortization and Depletion 16 Depreciation and Amortization 17 Provision Expense/Write-Back 18 Provision for Doubtful Accounts 19 Total Operating Profit/Loss 20 Non-Operating Income/Expenses, Total 21 Total Net Finance Income/Expense 22 Net Interest Income/Expense 23 Interest Expense Net of Capitalized Interest 24 Interest Income 25 Net Investment Income 26 Gain/Loss on Investments and Other Financial Instruments 27 Gain/Loss on Foreign Exchange 28 Other Investment Income 29 Irregular Income/Expenses 30 Litigation Income/Expense 31 Other Income/Expense, Non-Operating 32 Pretax Income 33 Provision for Income Tax 6,743,000,000 -221,000,000 -154,000,000 -154,000,000 -154,000,000 8,374,000,000 -1,170,000,000 -186,000,000 -186,000,000 -186,000,000 9,696,000,000 35,000,000 -224,000,000 -224,000,000 -224,000,000 -50,000,000 158,000,000 232,000,000 167,000,000 -106,000,000 36,000,000 -32,000,000 56,000,000 122,000,000 97,000,000 -15,000,000 -1,128,000,000 0 -15,000,000 -1,128,000,000 0 -2,000,000 -14,000,000 27,000,000 6,522,000,000 7,204,000,000 9,731,000,000 -2,607,000,000 -1,345,000,000 -1,613,000,000 101 000 000 + ----------- POLO Ratios MA Income Statement MA Balance Sheet MA Cash Flow -2,607,000,000 -1,345,000,000 -1,613,000,000 3,915,000,000 5,859,000,000 8,118,000,000 3,915,000,000 5,859,000,000 8,118,000,000 3,915,000,000 5,859,000,000 8,118,000,000 3,915,000,000 5,859,000,000 8,118,000,000 3,915,000,000 5,859,000,000 8,118,000,000 33 Provision for Income Tax 34 Net Income from Continuing Operations 35 Net Income after Extraordinary Items and Discontinued Operations 36 Net Income after Non-Controlling/Minority Interests 37 Net Income Available to Common Stockholders 38 Diluted Net Income Available to Common Stockholders 39 Non-Controlling/Minority Interests 40 Reported Total Revenue 41 Reported Operating Expense 42 Reported Total Operating Profit/Loss 43 Reported Normalized Income 44 Reported Effective Tax Rate 45 Reported Normalized Operating Profit 46 Basic EPS 47 Diluted EPS 48 Basic WASO 49 Diluted WASO 50 Fiscal year ends in Dec 31 | USD 12,497,000,000 14,950,000,000 16,883,000,000 -5,875,000,000 -7,668,000,000 -7,219,000,000 6,622,000,000 7,282,000,000 9,664,000,000 4,906,000,000 6,792,000,000 7,937,000,000 0 0 0 3.67 3.65 1,067,000,016 1,072,000,016 5.63 5.60 1,041,000,015 1,047,000,015 7.98 7.94 1,017,000,015 1,022,000,015 1. Ratios MA Income Statement MA Balance Sheet MA Cash Flow 2017 21,329,000,000 13,797,000,000 7,782,000,000 5,933,000,000 1,849,000,000 1,849,000,000 D 2018 2019 24,860,000,000 29,236,000,000 16,171,000,000 16,902,000,000 8,378,000,000 7,676,000,000 6,682,000,000 6,988,000,000 1,696,000,000 688,000,000 1,696,000,000 688,000,000 1,631,000,000 3,344,000,000 3,344,000,000 1,633,000,000 4,728,000,000 4,728,000,000 1,954,000,000 5,509,000,000 5,509,000,000 77,000,000 963,000,000 51,000,000 1,381,000,000 105,000,000 1,658,000,000 A 1 MA_Balance Sheet_Annual_As_Originally_Reported 2 Total Assets 3 Total Current Assets 4. Cash, Cash Equivalents and Short Term Investments 5 Cash and Cash Equivalents 6 Short Term Investments 7 Available-for-Sale Securities, Current 8 8 Held-to-Maturity Securities, Current 9 Cash Restricted or Pledged, Current 10 Trade and Other Receivables, Current 11 Trade/Accounts Receivable, Current 12 Taxes Receivable, Current 13 Other Receivables, Current 14 14 Prepayments and Deposits, Current 15 Other Current Assets 16 Deferred Tax Assets, Current 17 17 Deferred Costs/Assets, Current 18 Total Non-Current Assets 10 19 Net Property, Plant and Equipment 20 Gross Property, plant and Equipment 21 Properties Buildin 22 Buildings and improvements 23 Leasehold and Improvements 24 Machinery, Furniture and Equipment 25 Furniture, Fixtures and Office Equipment 26 Other Equipment 27 Leased Property, plant and Equipment 28 Other Property, Plant and Equipment 29 Accumulated Depreciation and Impairment 30 Accumulated Depreciation 31 Net Intangible Assets 32 Gross Goodwill and Other Intangible Assets 33 Goodwill ---LI. --------...!! Ratios MA Income Statement MA Balance Sheet MA Cash Flow 7,532,000,000 829,000,000 1,543,000,000 621,000,000 455,000,000 166,000,000 81,000,000 81,000,000 0 8,689,000,000 921,000,000 1,768,000,000 696,000,000 481,000,000 215,000,000 85,000,000 85,000,000 0 12,334,000,000 1,828,000,000 2,928,000,000 808,000,000 505,000,000 303,000,000 92,000,000 92,000,000 0 810,000,000 1,218,000,000 -1,100,000,000 -1,100,000,000 5,438,000,000 6,734,000,000 4,021,000,000 74 Annon 841,000,000 -714,000,000 -714,000,000 4,155,000,000 5,312,000,000 3,035,000,000 987,000,000 -847,000,000 -847,000,000 3,895,000,000 5,070,000,000 2,904,000,000 CF AAA ANA 2,277,000,000 2,166,000,000 2,713,000,000 1,572,000,000 1,514,000,000 1,884,000,000 648,000,000 606,000,000 785,000,000 27,000,000 46,000,000 44,000,000 30,000,000 -1,157,000,000 -1,175,000,000 -1,296,000,000 -1,157,000,000 -1,175,000,000 -1,296,000,000 -1,157,000,000 -1,175,000,000 -1,296,000,000 -888,000,000 -898,000,000 -988,000,000 -214,000,000 -232,000,000 -264,000,000 -26,000,000 -45,000,000 -44,000,000 -29,000,000 249,000,000 337,000,000 914,000,000 249,000,000 337,000,000 914,000,000 249,000,000 337,000,000 914,000,000 34 Intangibles other than Goodwill 35 Software and Technology 36 Customer Relationships 37 Other Intangible Assets 38 Trademarks and Patents and ralen 39 Accumulated Amortization and Impairment 40 Accumulated Amortization of Intangible Assets 41 Accumulated Amortization of Intangibles other than Goodwill 22 42 Accumulated Amortization of Software and Technology 43 Accumulated Amortization of Customer Relationships 44 Accumulated Amortization of Other Intangible Assets 45 Accumulated Amortization of Trademarks and Patents 46 Total Long Term Investments 47 Investment in Financial Assets, Non-Current 48 Equity Securities/Shares, Non-Current 49 Financial Investment Securities, Available-for-Sale & Held-to-Maturity, Non-Current 50 Available-for-Sale Securities, Non-Current 51 Held-to-Maturity Securities, Non-Current 52 Trade and Other Receivables, Non-Current 53 Taxes Receivable, Non-Current 54 Deferred Tax Assets, Non-Current 55 Other Non-Current Assets 56 Prepayments and Deposits, Non-Current 57 Prepayments, Non-Current 58 Deferred Costs/Assets, Non-Current 59 Total Liabilities 60 Total Current Liabilities 61 Payables and Accrued Expenses, Current 62 Trade and Other Payables, Current 63 Trade/Accounts Payable, Current 64 Taxes Payable, Current 65 Other Payable, Current 66 Amount Due to Related Parties/Shareholders, Current 178,000,000 178,000,000 250,000,000 1,519,000,000 352,000,000 352,000,000 298,000,000 298,000,000 570,000,000 2,668,000,000 0 0 460,000,000 460,000,000 543,000,000 3,151,000,000 15,832,000,000 8,793,000,000 6,916,000,000 2,470,000,000 933,000,000 194,000,000 1,343,000,000 19,442,000,000 23,319,000,000 11,593,000,000 11,904,000,000 9,064,000,000 9,606,000,000 2,884,000,000 3,535,000,000 537,000,000 489,000,000 158,000,000 332,000,000 2,189,000,000 2,714,000,000 - Mahaa CARA DA Ratios MA Income Statement MA Balance Sheet MA Cash Flow MC Don Ann : + B D E 66 67 4,446,000,000 68 6,071,000,000 0 o 6,180,000,000 500,000,000 500,000,000 500,000,000 500,000,000 500,000,000 2,029,000,000 0 0 0 2,298,000,000 1,877,000,000 69 70 71 72 73 74 75 76 77 78 79 80 81 82 02 83 85 84 84 A Amount Due to Related Parties/Shareholders, Current Accrued Expenses, Current Financial Liabilities, Current Current Debt and Capital Lease Obligation Current Portion of Long Term Debt and Capital Lease Current Portion of Long Term Debt Other Current Portion of LT Debt Other Current Liabilities Provisions, Current Provision for Employee Entitlements, Current Total Non-Current Liabilities Financial Liabilities, Non-Current Long Term Debt and Capital Lease Obligation Long Term Debt Notes Payables, Non-Current Tax Liabilities, Non-Current Deferred Tax Liabilities, Non-Current Other Non-Current Liabilities Preferred Securities Outside Stock Equity 85 Total Equity 7,039,000,000 7,849,000,000 11,415,000,000 5,424,000,000 5,834,000,000 8,527,000,000 5,424,000,000 5,834,000,000 8,527,000,000 5,424,000,000 5,834,000,000 8,527,000,000 5,834,000,000 8,527,000,000 106,000,000 67,000,000 85,000,000 106,000,000 67,000,000 85,000,000 1,438,000,000 1,877,000,000 2,729,000,000 71,000,000 71,000,000 74,000,000 5,497,000,000 5,418,000,000 5,917,000,000 5,468,000,000 5,395,000,000 5,893,000,000 -16,399,000,000 -21,170,000,000 -27,418,000,000 4,365,000,000 4,580,000,000 4,787,000,000 0 0 4,365,000,000 4,580,000,000 4,787,000,000 -20,764,000,000 -25,750,000,000 -32,205,000,000 22,364,000,000 27,283,000,000 33,984,000,000 -497,000,000 -718,000,000 -673,000,000 88 86 Equity Attributable to Parent Stockholders -- 87 Paid in Capital o Capital Stock 89 Common Stock 90 Additional Paid in Capital/Share Premium . 91 Treasury Stock 92 Retained Earnings/Accumulated Deficit 93 Reserves/Accumulated Comprehensive Income/Losses 941 Cumulative Foreign Exchange Translation Reserves/Accum. Comp. Inc 95 Available for Sale Financial Investments Reserves/Accum. Comp. Inc 96 Pension and Other Post-Retirement Benefit Plans Reserves/Accum. Comp. Inc 97 Non-Controlling/Minority Interests 98 Common Shares Issued 99 Common Shares Outstanding 100 Common Shares Treasury 101 Common Stock, with Par Value 102 Fiscal year ends in Dec 31 USD Ratios MA Income Statement MA Balance Sheet MA Cash Flow 29,000,000 1,396,000,000 1,054,000,000 342,000,000 23,000,000 1,399,000,000 1,031,000,000 368,000,000 24,000,000 1,402,414,514 1,007,414,514 395,000,000 E B 2017 5,555,000,000 5,555,000,000 5,555,000,000 3,915,000,000 1,926,000,000 437,000,000 437,000,000 176,000,000 86,000,000 C 2018 6,223,000,000 6,223,000,000 6,223,000,000 5,859,000,000 1,677,000,000 459,000,000 459,000,000 196,000,000 -244,000,000 D 2019 8,183,000,000 8,183,000,000 8,183,000,000 8,118,000,000 1,763,000,000 522,000,000 522,000,000 250,000,000 -7,000,000 -167,000,000 -167,000,000 1,165,000,000 1,227,000,000 1,266,000,000 A MA_CashFlow_Annual_As_Originally_Reported 2 Cash Flow from Operating Activities, Indirect 3 Net Cash Flow from Continuing Operating Activities, Indirect 4 Cash Generated from Operating Activities 5 Income/Loss before Non-Cash Adjustment 6 Total Adjustments for Non-Cash Items 7 Depreciation, Amortization and Depletion, Non-Cash Adjustment 8 Depreciation and Amortization, Non-Cash Adjustment 9 Stock-Based Compensation, Non-Cash Adjustment 10 Taxes, Non-Cash Adjustment 11 Net Investment Income/Loss, Non-Cash Adjustment 12 Gain/Loss on Financial Instruments, Non-Cash Adjustment 13 Other Non-Cash Items 14 Excess Tax Benefit from Stock-Based Compensation, Non-Cash Adjustment 15 Changes in Operating Capital 16 Change in Trade and Other Receivables 17 Change in Trade/Accounts Receivable 18 Change in Tax Receivables 19 Change in Prepayments and Deposits 20 Change in Cash Restricted or Pledged 21 Change in Payables and Accrued Expenses 22 Change in Trade and Other Payables 23 Change in Trade/Accounts Payable 24 Change in Other Payables 25 Change in Taxes Payable 26 Change in Accrued Expenses 27 Change in Other Operating Capital 28 Change in Other Current Liabilities 29 Cash Flow from Investing Activities 30 Cash Flow from Continuing Investing Activities 31 Capital Expenditure, Reported 32 Purchase/Sale and Disposal of Property, Plant and Equipment, Net 33 Purchase of Property, plant and Equipment C.AL Ratios MA Income Statement MA Balance Sheet MA Cash Flow -286,000,000 -726,000,000 -726,000,000 -1,402,000,000 -1,313,000,000 -1,515,000,000 -1,395,000,000 -120,000,000 -1,769,000,000 -6,000,000 2,258,000,000 950,000,000 101,000,000 849,000,000 0 1,308,000,000 -281,000,000 -1,698,000,000 -892,000,000 -690,000,000 -202,000,000 -1,661,000,000 290,000,000 430,000,000 435,000,000 -42,000,000 477,000,000 1,258,000,000 684,000,000 290,000,000 394,000,000 574,000,000 584,000,000 -5,000,000 135,000,000 -1,779,000,000 -1,779,000,000 -123,000,000 -300,000,000 -300,000,000 -506,000,000 -506,000,000 -174,000,000 -330,000,000 -330,000,000 -1,640,000,000 -1,640,000,000 -306,000,000 -422,000,000 -422,000,000 I... Ir 14 AA AAN 1 AA AAA AAN + E B C D -300,000,000 -330,000,000 -422,000,000 -1,175,000,000 0 -1,440,000,000 -1,175,000,000 0 -1,440,000,000 -182,000,000 12,000,000 532,000,000 -2,006,000,000 -1,900,000,000 -1,325,000,000 1,824,000,000 1,912,000,000 1,857,000,000 1,000,000 -14,000,000 -4,000,000 0 0 0 0 0 0 0 A 33 Purchase of Property, Plant and Equipment 34 Purchase/Sale of Business, Net 35 Purchase/Acquisition of Business 36 Purchase/Sale of Investments, Net 37 Purchase of Investments 38 Sale of Investments 39 Other Investing Cash Flow 40 Purchase/Sale of Equity Investments 41 Purchase of Joint Venture/Associate 42 Change in Restricted Cash and Cash Equivalents 43 Purchase/Sale of Intangibles, Net 44 Purchase of Intangibles 45 Cash Flow from Financing Activities 46 Cash Flow from Continuing Financing Activities 47 Issuance of/Payments for Common Stock, Net 48 Payments for Common Stock 49 Issuance of/Repayments for Debt, Net 50 Issuance of/Repayments for Long Term Debt, Net 51 Proceeds from Issuance of Long Term Debt 52 Repayments for Long Term Debt 53 Net Movement in Non-Controlling/Minority Interest 54 Cash Dividends and Interest Paid 55 Cash Dividends Paid 56 Common Stock Dividends Paid 57 Proceeds from Issuance/Exercising of Stock Options/Warrants 58 Other Financing Cash Flow 59 Excess Tax Benefit from Share-Based Compensation, Financing Activities 60 Cash and Cash Equivalents, End of Period 61 Change in Cash 62 Effect of Exchange Rate Changes 63 Cash and Cash Equivalents, Beginning of Period 64 Change in Cash As Reported, Supplemental 65 Fiscal year ends in Dec 31 USD Ratios MA Income Statement MA Balance Sheet MA Cash Flow -4,764,000,000 -4,966,000,000 -5,867,000,000 -4,764,000,000 -4,966,000,000 -5,867,000,000 -3,762,000,000 -4,933,000,000 -6,497,000,000 -3,762,000,000 -4,933,000,000 -6,497,000,000 -64,000,000 991,000,000 2,224,000,000 -64,000,000 991,000,000 2,224,000,000 991,000,000 2,724,000,000 -64,000,000 0 0 -500,000,000 -942,000,000 -1,044,000,000 -1,345,000,000 -942,000,000 -1,044,000,000 -1,345,000,000 -942,000,000 -1,044,000,000 -1,345,000,000 57,000,000 104,000,000 126,000,000 -53,000,000 -84,000,000 -375,000,000 0 5,933,000,000 8,337,000,000 8,969,000,000 -988,000,000 751,000,000 676,000,000 200,000,000 -6,000,000 -44,000,000 6,721,000,000 7,592,000,000 8,337,000,000 -788,000,000 745,000,000 632,000,000
Step by Step Solution
There are 3 Steps involved in it

Get step-by-step solutions from verified subject matter experts