

Question: Introduction Menards Corporate ( Eau Claire, WI ) hears about your advanced HRM skills in measurement and selection and contacts you for some consulting work.
Introduction
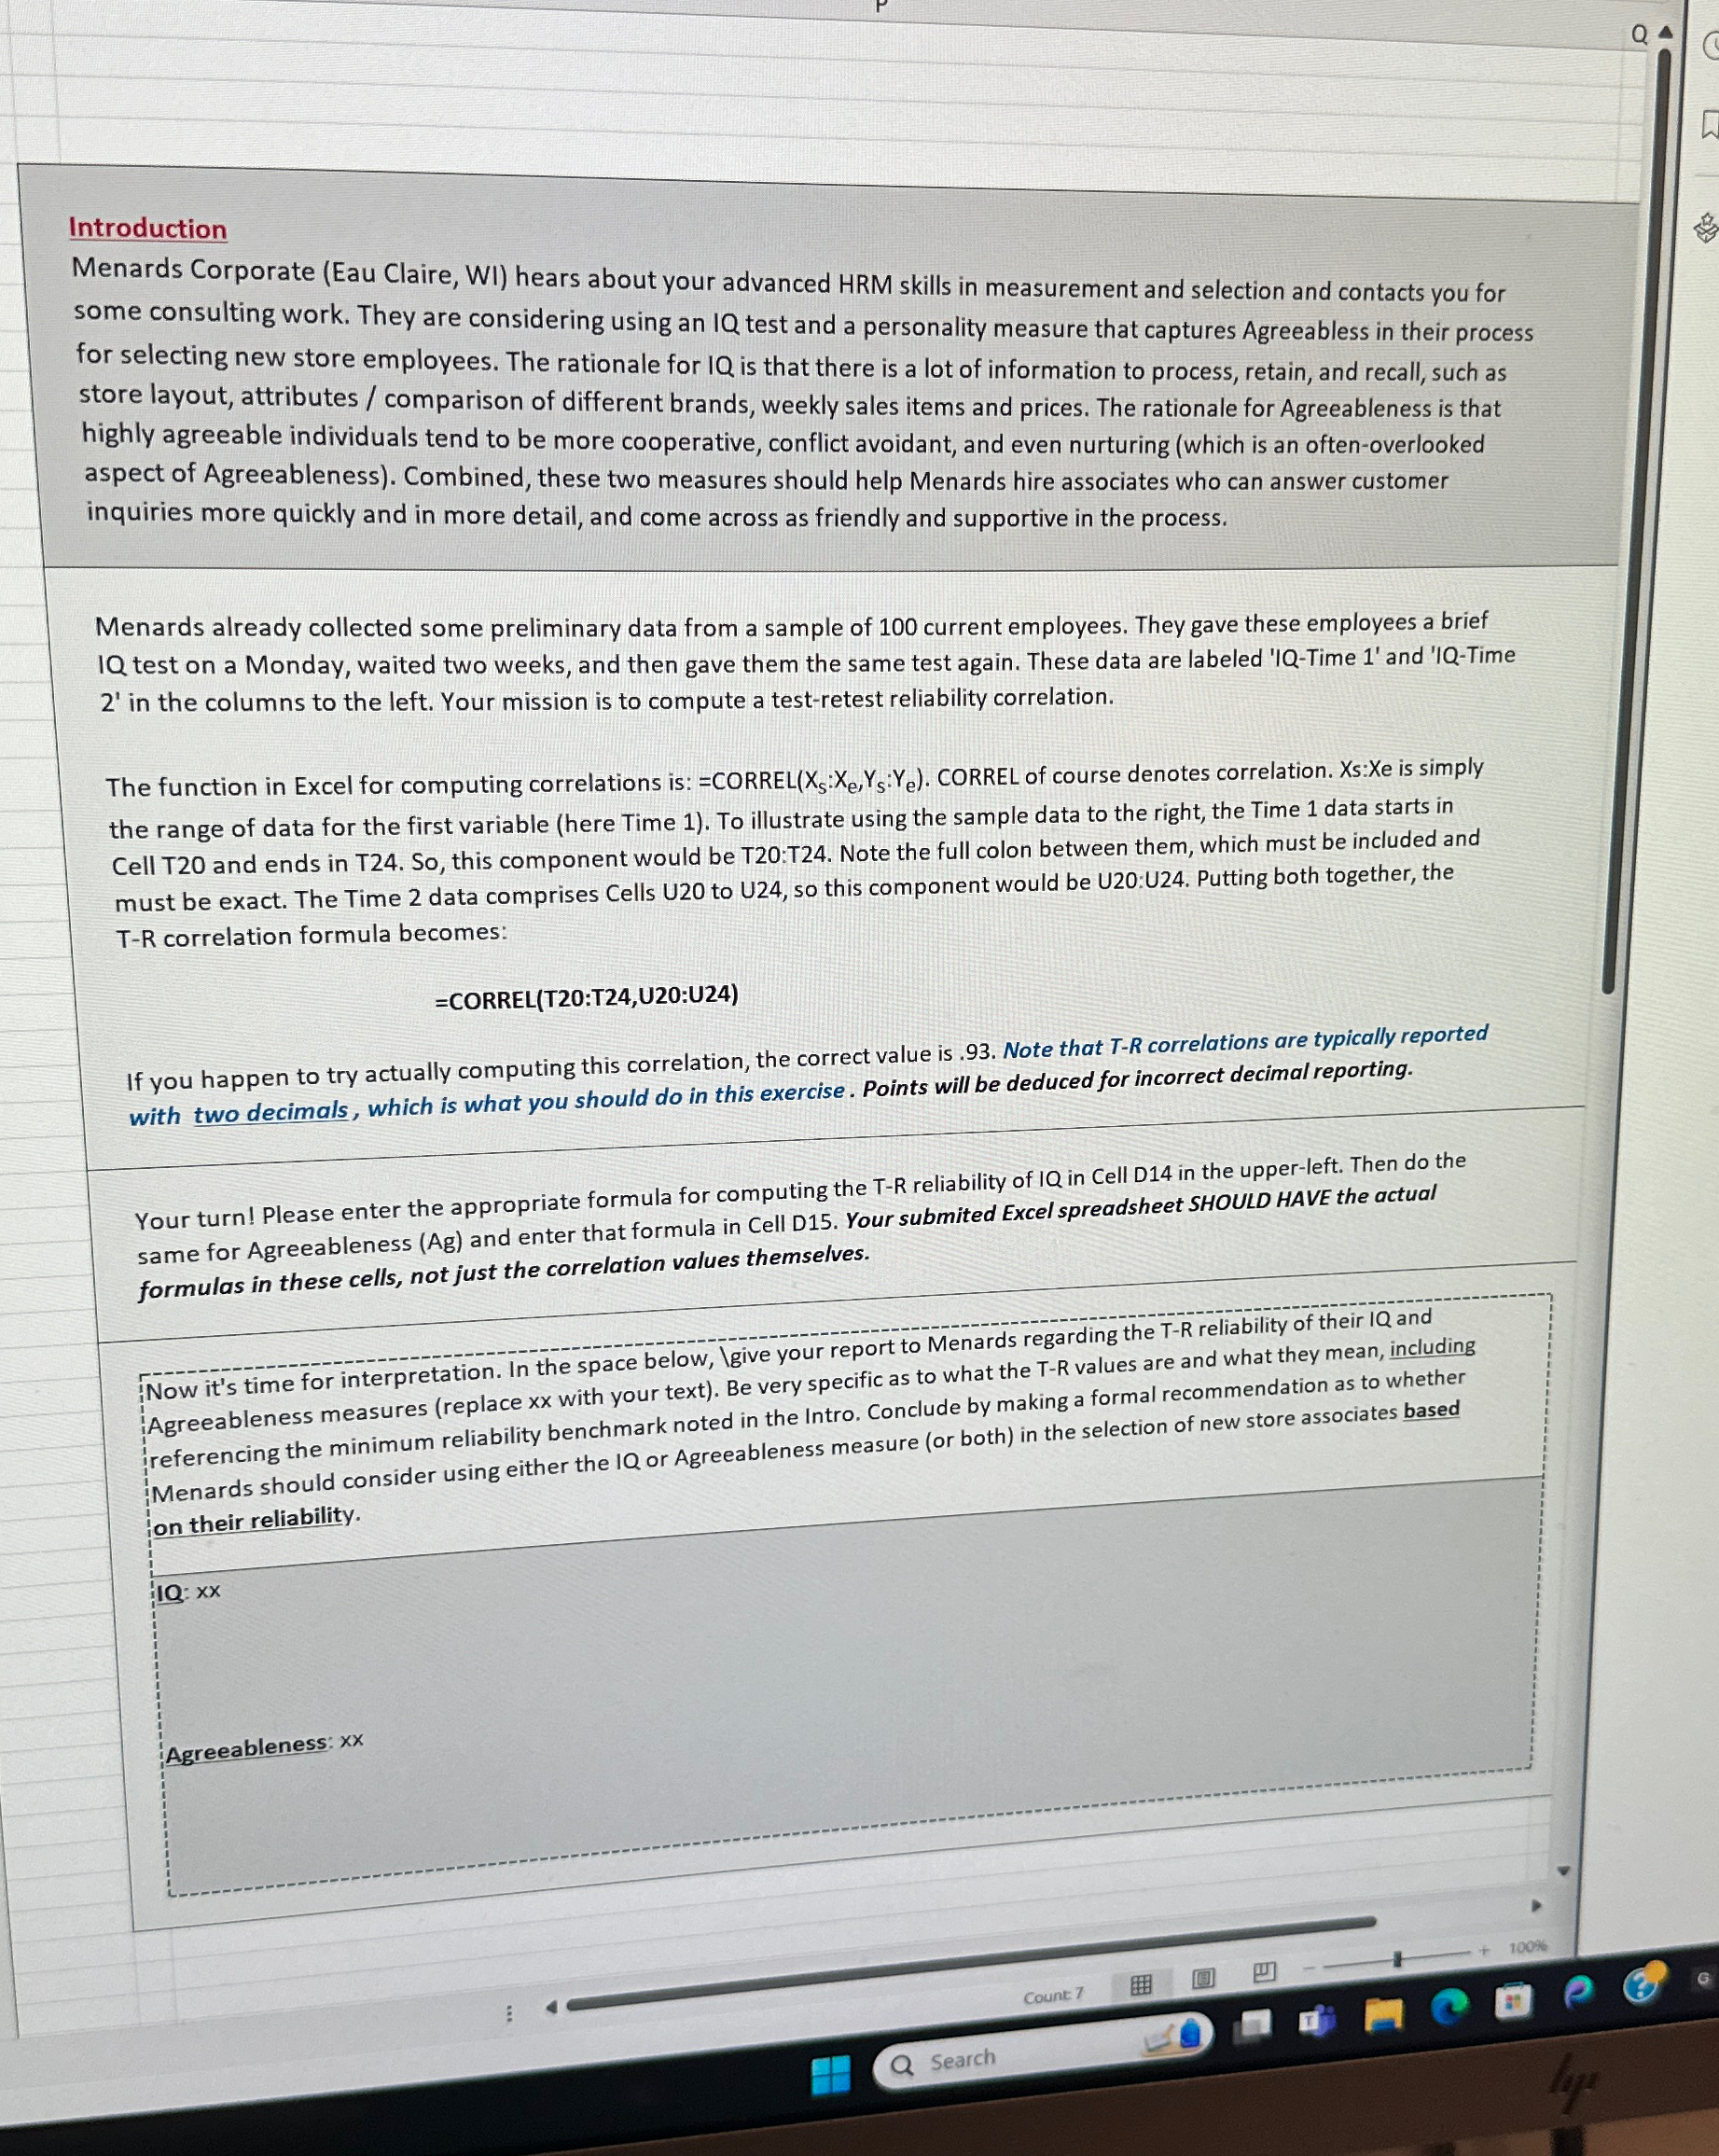
Menards Corporate Eau Claire, WI hears about your advanced HRM skills in measurement and selection and contacts you for some consulting work. They are considering using an IQ test and a personality measure that captures Agreeabless in their process for selecting new store employees. The rationale for IQ is that there is a lot of information to process, retain, and recall, such as store layout, attributes comparison of different brands, weekly sales items and prices. The rationale for Agreeableness is that highly agreeable individuals tend to be more cooperative, conflict avoidant, and even nurturing which is an oftenoverlooked aspect of Agreeableness Combined, these two measures should help Menards hire associates who can answer customer inquiries more quickly and in more detail, and come across as friendly and supportive in the process.
Menards already collected some preliminary data from a sample of current employees. They gave these employees a brief IQ test on a Monday, waited two weeks, and then gave them the same test again. These data are labeled Time and Time in the columns to the left. Your mission is to compute a testretest reliability correlation.
The function in Excel for computing correlations is: CORREL :: CORREL of course denotes correlation. : is simply the range of data for the first variable here Time To illustrate using the sample data to the right, the Time data starts in Cell and ends in So this component would be T:T Note the full colon between them, which must be included and must be exact. The Time data comprises Cells U to U so this component would be U:U Putting both together, the correlation formula becomes:
CORRELT:TU:U
If you happen to try actually computing this correlation, the correct value is Note that correlations are typically reported with two decimals, which is what you should do in this exercise. Points will be deduced for incorrect decimal reporting.
Your turn! Please enter the appropriate formula for computing the TR reliability of IQ in Cell D in the upperleft. Then do the same for Agreeableness Ag and enter that formula in Cell D Your submited Excel spreadsheet SHOULD HAVE the actual formulas in these cells, not just the correlation values themselves.
Now it's time for interpretation. In the space below, give your report to Menards regarding the TR reliability of their IQ and Agreeableness measures replace with your text Be very specific as to what the TR values are and what they mean, including referencing the minimum reliability benchmark noted in the Intro. Conclude by making a formal recommendation as to whether Menards should consider using either the IQ or Agreeableness measure or both in the selection of new store associates based on their reliability.
Q:
Agreeableness:
Step by Step Solution
There are 3 Steps involved in it
1 Expert Approved Answer
Step: 1 Unlock

Question Has Been Solved by an Expert!
Get step-by-step solutions from verified subject matter experts
Step: 2 Unlock
Step: 3 Unlock