

Question: Introduction to Financial Forecasting Vinyl Structures (VS) VS has experienced rapid growth over the past several years. Sales are expected to grow @11% per annum
Introduction to Financial Forecasting
Vinyl Structures (VS)
VS has experienced rapid growth over the past several years. Sales are expected to grow @11% per annum for the next three years.
Asset growth has been financed by internal funds as well as the increased use of debt. At the end of 2015 debt was restructured with a new 7-year loan with principal payments of $1m per year and an interest rate of 6%.
VS working capital line (notes payable) was increased to a maximum of 3.5 million in 2015. Interest was charged @6% VS would like to keep its line of credit at $2.5 million.
VS is planning to pay out dividends of $600,000 per annum.
Assume Gross Fixed Assets will be 24% of Revenue and Depreciation will be 2.00% of Revenue.
Cash balances will be kept at around $300,000 and the firm has a 30% tax rate.
Build formulas for the worksheet rather than copying from the DEMO we did in class. No two firms are the same. Building the worksheet will generate a better understanding of the forecasting process.
- Prepare Common Size Statements (%age of Sales) for both I/S & B/S.
- Prepare pro-forma statements (I/S and B/S) for VS and determine their need for funds for the years 2018-2020.
- Assume VS has a cost of capital of 10%. Is VS expected to have satisfactory financial performance in 2018.
- What would happen to VSs profit, need for funds and ROIC if A/R was decreased to 63 days and A/P was increased to 50 days for the period 2018-2020.
- If expected sales growth fell to 7% in 2018 through 2020 per annum what would be VSs need for funds using your assumptions from question 2?
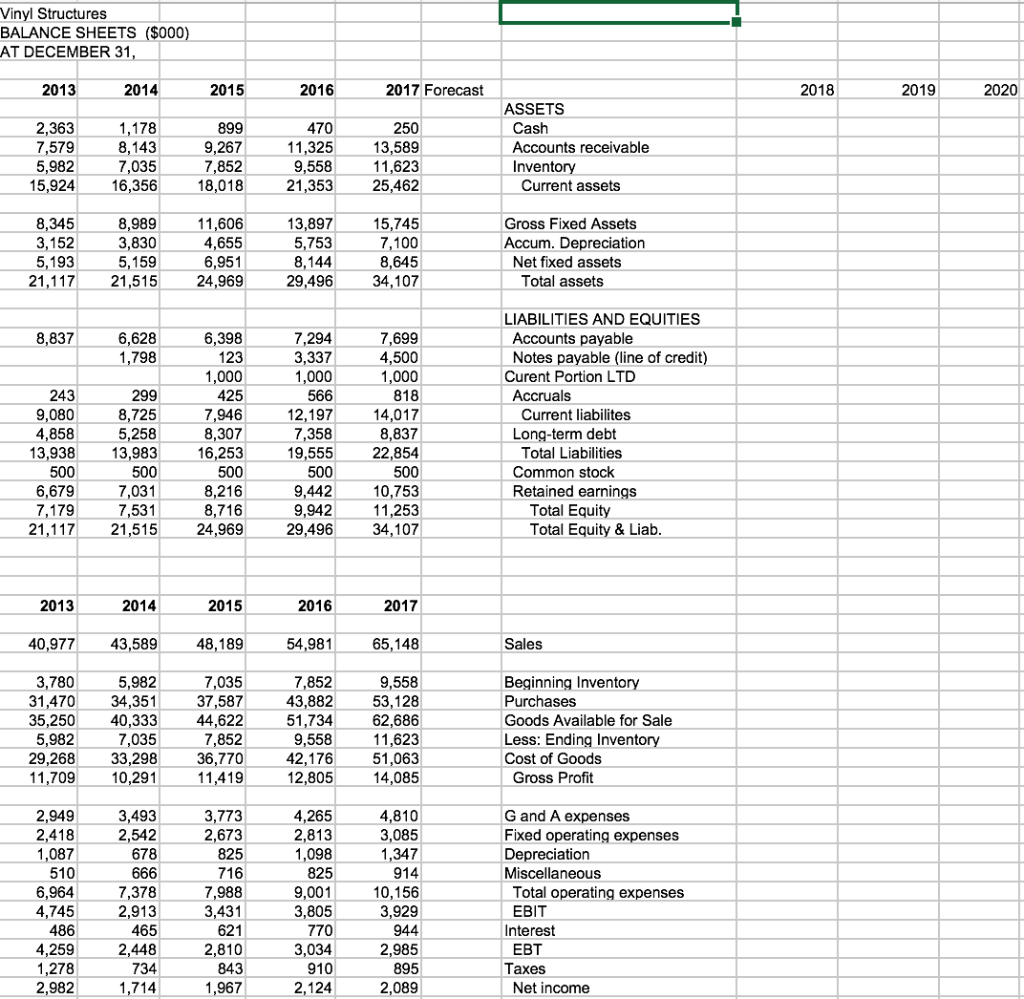
Vinyl Structures BALANCE SHEETS ($000) AT DECEMBER 31, 2013 2014 2015 2016 2017 Forecast 2018 2019 2020 250 2,363 7,579 5,982 15,924 1,178 8,143 7,035 899 9,267 7,852 18,018 470 11,325 9,558 21,353 13,589 11,623 25,462 ASSETS Cash Accounts receivable Inventory Current assets 16,356 8,345 3,152 5,193 21,117 8,989 3,830 5,159 21,515 11,606 4,655 6,951 24,969 13,897 5,753 8,144 29,496 15,745 7,100 8,645 34,107 Gross Fixed Assets Accum. Depreciation Net fixed assets Total assets 8,837 6,628 1,798 243 9,080 4,858 13,938 500 6,679 7,179 21,117 299 8,725 5,258 13,983 500 7,031 7,531 21,515 6,398 123 1,000 425 7,946 8,307 16,253 500 8,216 8,716 24,969 7,294 3,337 1,000 566 12,197 7,358 19,555 500 9,442 9,942 29,496 7,699 4,500 1,000 818 14,017 8,837 22,854 500 10,753 11,253 34,107 LIABILITIES AND EQUITIES Accounts payable Notes payable (line of credit) Curent Portion LTD Accruals Current liabilites Long-term debt Total Liabilities Common stock Retained earnings Total Equity Total Equity & Liab. 2013 2014 2015 2016 2017 40,977 43,589 48,189 54,981 65,148 Sales 3,780 31,470 35,250 5,982 29,268 11,709 5,982 34,351 40,333 7,035 33,298 10,291 7,035 37,587 44,622 7,852 36,770 11,419 7,852 43,882 51,734 9,558 42,176 12,805 9,558 53,128 62,686 11,623 51,063 14,085 Beginning Inventory Purchases Goods Available for Sale Less: Ending Inventory Cost of Goods Gross Profit 2,949 2,418 1,087 510 6,964 4,745 486 4,259 1,278 2,982 3,493 2,542 678 666 7,378 2,913 465 2,448 734 1,714 3,773 2,673 825 716 7,988 3,431 621 2,810 843 1,967 4,265 2,813 1,098 825 9,001 3,805 770 3,034 910 2,124 4,810 3,085 1,347 914 10,156 3,929 944 2,985 895 2,089 G and A expenses Fixed operating expenses Depreciation Miscellaneous Total operating expenses EBIT Interest EBT Taxes Net income Vinyl Structures BALANCE SHEETS ($000) AT DECEMBER 31, 2013 2014 2015 2016 2017 Forecast 2018 2019 2020 250 2,363 7,579 5,982 15,924 1,178 8,143 7,035 899 9,267 7,852 18,018 470 11,325 9,558 21,353 13,589 11,623 25,462 ASSETS Cash Accounts receivable Inventory Current assets 16,356 8,345 3,152 5,193 21,117 8,989 3,830 5,159 21,515 11,606 4,655 6,951 24,969 13,897 5,753 8,144 29,496 15,745 7,100 8,645 34,107 Gross Fixed Assets Accum. Depreciation Net fixed assets Total assets 8,837 6,628 1,798 243 9,080 4,858 13,938 500 6,679 7,179 21,117 299 8,725 5,258 13,983 500 7,031 7,531 21,515 6,398 123 1,000 425 7,946 8,307 16,253 500 8,216 8,716 24,969 7,294 3,337 1,000 566 12,197 7,358 19,555 500 9,442 9,942 29,496 7,699 4,500 1,000 818 14,017 8,837 22,854 500 10,753 11,253 34,107 LIABILITIES AND EQUITIES Accounts payable Notes payable (line of credit) Curent Portion LTD Accruals Current liabilites Long-term debt Total Liabilities Common stock Retained earnings Total Equity Total Equity & Liab. 2013 2014 2015 2016 2017 40,977 43,589 48,189 54,981 65,148 Sales 3,780 31,470 35,250 5,982 29,268 11,709 5,982 34,351 40,333 7,035 33,298 10,291 7,035 37,587 44,622 7,852 36,770 11,419 7,852 43,882 51,734 9,558 42,176 12,805 9,558 53,128 62,686 11,623 51,063 14,085 Beginning Inventory Purchases Goods Available for Sale Less: Ending Inventory Cost of Goods Gross Profit 2,949 2,418 1,087 510 6,964 4,745 486 4,259 1,278 2,982 3,493 2,542 678 666 7,378 2,913 465 2,448 734 1,714 3,773 2,673 825 716 7,988 3,431 621 2,810 843 1,967 4,265 2,813 1,098 825 9,001 3,805 770 3,034 910 2,124 4,810 3,085 1,347 914 10,156 3,929 944 2,985 895 2,089 G and A expenses Fixed operating expenses Depreciation Miscellaneous Total operating expenses EBIT Interest EBT Taxes Net income
Step by Step Solution
There are 3 Steps involved in it

Get step-by-step solutions from verified subject matter experts