

Question: Introductory statistics 5. The line graph below shows the GDP of two countries over a 60-year period. GDP per Capita $10,000 $8,000 $6,000 GDP per
Introductory statistics
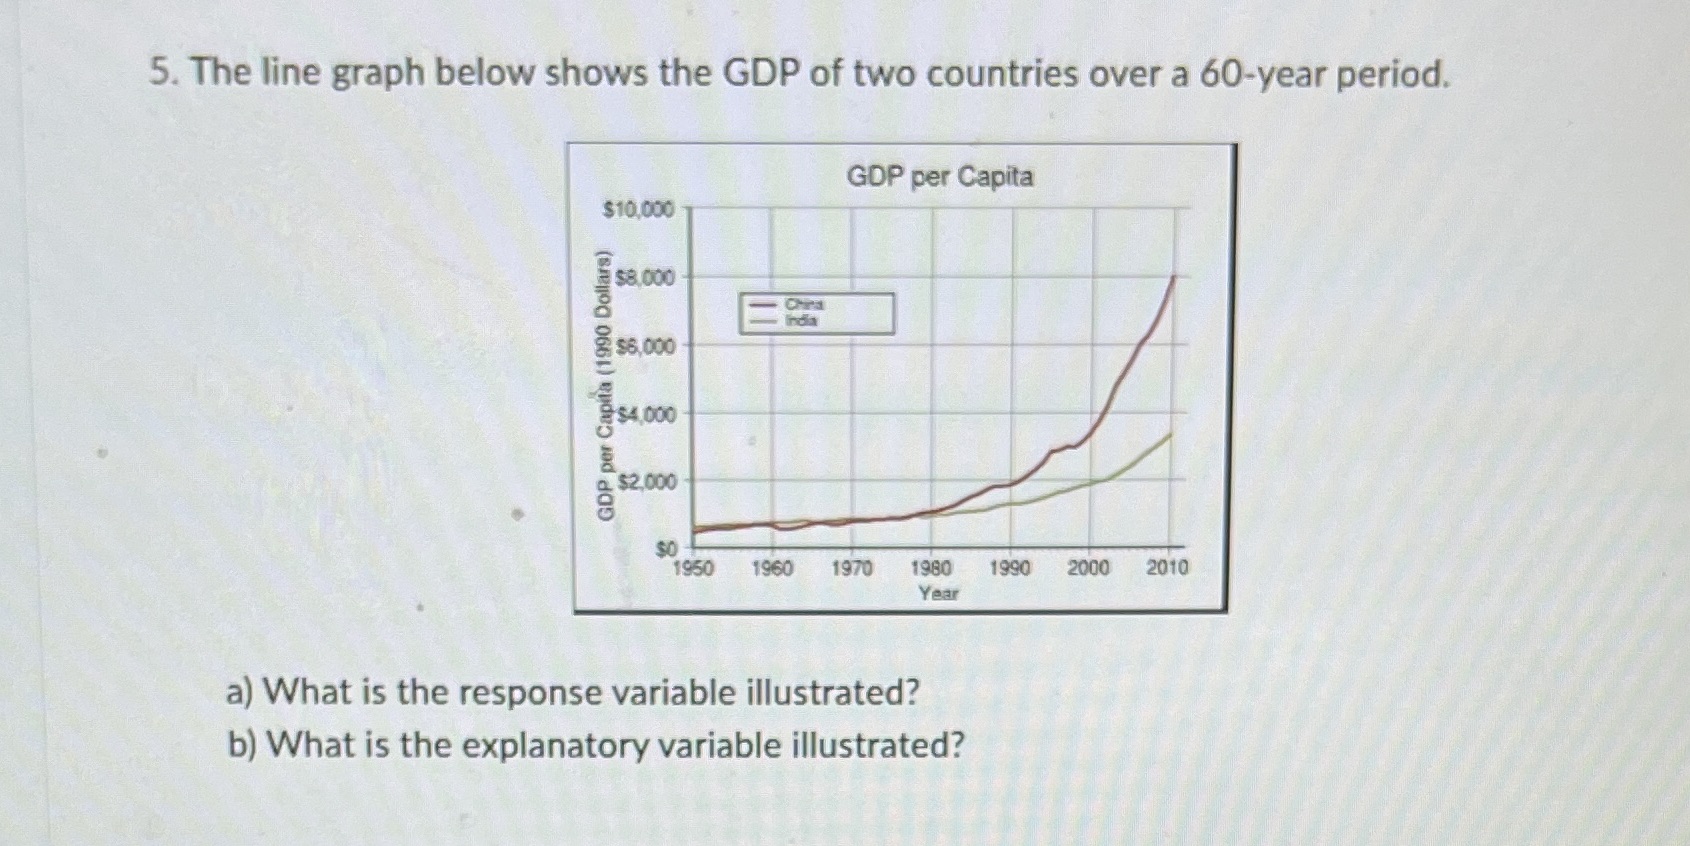
5. The line graph below shows the GDP of two countries over a 60-year period. GDP per Capita $10,000 $8,000 $6,000 GDP per Capita (1990 Dollars) $4,000 $2.000 SO 1950 1960 1970 1980 1990 2000 2010 Year a) What is the response variable illustrated? b) What is the explanatory variable illustrated
Step by Step Solution
There are 3 Steps involved in it
1 Expert Approved Answer
Step: 1 Unlock

Question Has Been Solved by an Expert!
Get step-by-step solutions from verified subject matter experts
Step: 2 Unlock
Step: 3 Unlock