

Question: Investor utility is represented by: U = E(R) - A2 . There are two investors with different risk aversion coefficients (A). Angela has a risk
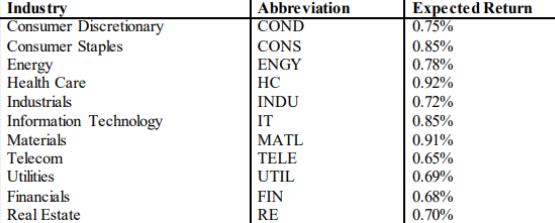
Investor utility is represented by: U = E(R) - ½Aσ2 . There are two investors with different risk aversion coefficients (A). Angela has a risk aversion coefficient of 6 and Boris has a risk aversion coefficient of 2. Investors are able to short-sell each industry throughout the report. Investors are unable to borrow or lend at the risk-free rate except for part 5 of the report. Please use sample variance and standard deviation, rather than population variance and standard deviation. The expected returns per month to be used throughout the report are in the following table.
| Date | COND | CONS | ENGY | HC | INDU | IT | MATL | TELE | UTIL | FIN | RE |
| 31/01/2017 | -0.0430 | -0.0104 | 0.0072 | 0.0456 | -0.0441 | -0.0418 | 0.0477 | -0.0168 | 0.0108 | -0.0205 | -0.0460 |
| 28/02/2017 | 0.0151 | 0.0602 | -0.0213 | 0.0390 | 0.0341 | 0.0185 | -0.0319 | -0.0314 | 0.0307 | 0.0413 | 0.0433 |
| 31/03/2017 | 0.0473 | 0.0547 | 0.0433 | 0.0560 | 0.0435 | 0.0363 | 0.0022 | 0.0028 | 0.0628 | 0.0389 | 0.0095 |
| 28/04/2017 | 0.0070 | -0.0253 | -0.0055 | 0.0340 | 0.0409 | 0.0352 | -0.0025 | -0.0948 | 0.0308 | 0.0191 | 0.0249 |
| 31/05/2017 | -0.0032 | -0.0044 | 0.0152 | -0.0238 | 0.0469 | 0.0022 | -0.0024 | 0.0338 | 0.0100 | -0.0771 | -0.0075 |
| 30/06/2017 | 0.0087 | -0.0243 | -0.0684 | 0.0608 | -0.0025 | 0.0188 | 0.0063 | -0.0166 | -0.0269 | 0.0167 | -0.0413 |
| 31/07/2017 | -0.0063 | 0.0097 | 0.0062 | -0.0750 | -0.0274 | -0.0049 | 0.0348 | -0.0421 | -0.0528 | 0.0125 | -0.0017 |
| 31/08/2017 | -0.0154 | 0.0517 | 0.0518 | 0.0025 | 0.0457 | 0.0099 | 0.0452 | -0.0720 | 0.0322 | -0.0212 | 0.0137 |
| 29/09/2017 | -0.0006 | -0.0187 | 0.0112 | 0.0227 | -0.0111 | 0.0060 | -0.0138 | -0.0446 | -0.0364 | 0.0111 | 0.0119 |
| 31/10/2017 | 0.0544 | 0.0534 | 0.0641 | 0.0548 | 0.0418 | 0.0844 | 0.0444 | 0.0235 | 0.0496 | 0.0326 | 0.0132 |
| 30/11/2017 | 0.0087 | 0.0324 | 0.0433 | 0.0296 | 0.0221 | 0.0450 | 0.0201 | -0.0158 | 0.0298 | 0.0000 | 0.0474 |
| 29/12/2017 | 0.0368 | 0.0167 | 0.0652 | -0.0048 | -0.0095 | 0.0294 | 0.0611 | 0.0546 | -0.0448 | 0.0042 | 0.0038 |
| 31/01/2018 | -0.0020 | 0.0021 | -0.0028 | 0.0311 | -0.0201 | 0.0249 | 0.0046 | 0.0077 | -0.0435 | -0.0074 | -0.0323 |
| 28/02/2018 | -0.0119 | 0.0210 | -0.0375 | 0.0696 | -0.0037 | 0.0166 | 0.0037 | -0.0620 | -0.0159 | 0.0064 | -0.0187 |
| 30/03/2018 | -0.0226 | -0.0135 | -0.0249 | -0.0332 | -0.0114 | -0.0219 | -0.0424 | -0.0620 | -0.0075 | -0.0585 | -0.0013 |
| 30/04/2018 | 0.0295 | 0.0574 | 0.1072 | 0.0719 | 0.0308 | 0.0276 | 0.0744 | 0.0194 | 0.0216 | 0.0011 | 0.0410 |
| 31/05/2018 | 0.0527 | 0.0000 | 0.0041 | 0.0545 | 0.0124 | 0.0203 | 0.0197 | -0.1005 | 0.0103 | -0.0006 | 0.0301 |
| 29/06/2018 | 0.0209 | 0.0594 | 0.0774 | 0.0250 | 0.0064 | 0.0590 | 0.0165 | -0.0549 | 0.0591 | 0.0399 | 0.0256 |
| 31/07/2018 | 0.0175 | -0.0088 | 0.0118 | 0.0223 | 0.0316 | -0.0112 | -0.0025 | 0.0759 | -0.0143 | 0.0204 | 0.0099 |
| 31/08/2018 | 0.0359 | 0.0264 | -0.0122 | 0.1042 | 0.0326 | 0.1221 | -0.0486 | 0.1302 | 0.0061 | 0.0005 | 0.0261 |
| 28/09/2018 | -0.0383 | -0.0267 | 0.0427 | -0.0730 | -0.0215 | -0.0065 | 0.0406 | 0.0266 | -0.0310 | -0.0222 | -0.0186 |
| 31/10/2018 | -0.0834 | -0.0490 | -0.1028 | -0.0725 | -0.0529 | -0.1137 | -0.0518 | -0.0744 | -0.0403 | -0.0602 | -0.0380 |
| 30/11/2018 | -0.0453 | -0.0292 | -0.1068 | -0.0397 | -0.0060 | 0.0099 | -0.0475 | -0.0314 | -0.0176 | 0.0141 | -0.0259 |
| 31/12/2018 | -0.0194 | 0.0120 | -0.0220 | 0.0272 | -0.0029 | -0.0408 | 0.0513 | -0.0505 | 0.0277 | -0.0313 | 0.0107 |
| 31/01/2019 | 0.0428 | 0.0273 | 0.1146 | 0.0391 | 0.0338 | 0.0882 | 0.0697 | 0.0766 | 0.0592 | -0.0025 | 0.0585 |
| 28/02/2019 | 0.0669 | -0.0139 | 0.0784 | 0.0133 | 0.0644 | 0.0748 | 0.0640 | 0.0435 | 0.0403 | 0.0907 | 0.0219 |
| 29/03/2019 | 0.0139 | 0.0368 | -0.0415 | 0.0131 | 0.0198 | 0.0255 | 0.0340 | 0.0377 | 0.0132 | -0.0262 | 0.0541 |
| 30/04/2019 | 0.0546 | 0.0733 | 0.0155 | 0.0314 | 0.0315 | 0.0735 | -0.0205 | 0.0244 | -0.0049 | 0.0440 | -0.0167 |
| 31/05/2019 | 0.0204 | -0.0416 | -0.0380 | 0.0354 | 0.0025 | -0.0312 | 0.0311 | 0.0715 | -0.0062 | 0.0262 | 0.0258 |
| 28/06/2019 | -0.0151 | 0.0292 | 0.0217 | 0.0442 | 0.0555 | 0.0105 | 0.0617 | 0.0224 | 0.0308 | 0.0342 | 0.0324 |
| 31/07/2019 | 0.0475 | 0.0959 | 0.0149 | 0.0596 | 0.0335 | 0.0511 | 0.0117 | 0.0276 | 0.0185 | 0.0177 | 0.0319 |
| 30/08/2019 | 0.0064 | 0.0010 | -0.0562 | 0.0343 | -0.0250 | 0.0067 | -0.0734 | -0.0321 | -0.0224 | -0.0258 | 0.0240 |
| 30/09/2019 | 0.0333 | 0.0174 | 0.0446 | -0.0215 | -0.0013 | 0.0011 | 0.0295 | -0.0285 | 0.0201 | 0.0423 | -0.0229 |
| 31/10/2019 | 0.0055 | -0.0224 | 0.0031 | 0.0727 | 0.0289 | -0.0319 | -0.0176 | -0.0139 | 0.0123 | -0.0288 | 0.0177 |
| 29/11/2019 | 0.0422 | 0.0810 | 0.0729 | 0.0881 | 0.0397 | 0.1055 | 0.0444 | 0.0722 | -0.0053 | -0.0201 | 0.0233 |
| 31/12/2019 | -0.0221 | -0.0775 | -0.0138 | -0.0266 | -0.0305 | -0.0389 | 0.0182 | -0.0546 | 0.0078 | -0.0156 | -0.0448 |
| 31/01/2020 | 0.0427 | 0.0781 | 0.0057 | 0.1201 | 0.0186 | 0.1024 | 0.0163 | 0.0765 | 0.0098 | 0.0474 | 0.0600 |
| 28/02/2020 | -0.0874 | -0.0740 | -0.1742 | -0.0395 | -0.0841 | -0.1631 | -0.1169 | -0.0878 | -0.0396 | -0.0492 | -0.0449 |
| 31/03/2020 | -0.2642 | -0.0355 | -0.3764 | -0.0564 | -0.2301 | -0.1758 | -0.1325 | -0.1536 | -0.0674 | -0.2770 | -0.3558 |
| 30/04/2020 | 0.1644 | 0.0259 | 0.2521 | 0.0487 | 0.1282 | 0.2184 | 0.1437 | 0.0484 | 0.0323 | 0.0289 | 0.1412 |
| 29/05/2020 | 0.0690 | -0.0049 | 0.0474 | -0.0510 | 0.0381 | 0.1431 | 0.0839 | 0.0852 | 0.0305 | 0.0535 | 0.0706 |
| 30/06/2020 | 0.0506 | 0.0475 | -0.0212 | 0.0339 | -0.0157 | 0.0370 | 0.0217 | -0.0032 | 0.0085 | 0.0434 | -0.0145 |
| 31/07/2020 | 0.0288 | 0.0323 | -0.0626 | -0.0384 | -0.0380 | 0.0484 | 0.0591 | 0.0350 | -0.0023 | -0.0102 | -0.0010 |
| 31/08/2020 | 0.0971 | -0.0031 | 0.0342 | 0.0402 | 0.0462 | 0.1515 | 0.0116 | -0.0377 | -0.0480 | 0.0135 | 0.0761 |
| 30/09/2020 | -0.0242 | -0.0658 | -0.1074 | 0.0082 | -0.0032 | -0.0639 | -0.0286 | -0.0211 | -0.0332 | -0.0613 | -0.0134 |
| 30/10/2020 | 0.0107 | 0.0456 | -0.0097 | 0.0096 | -0.0348 | 0.0858 | -0.0105 | -0.0073 | -0.0149 | 0.0627 | 0.0029 |
| 30/11/2020 | 0.0843 | -0.0066 | 0.2824 | 0.0289 | 0.1198 | 0.0414 | 0.0766 | 0.1435 | 0.0147 | 0.1612 | 0.1323 |
| 31/12/2020 | 0.0139 | 0.0221 | -0.0069 | -0.0469 | -0.0218 | 0.0857 | 0.0877 | -0.0068 | -0.0538 | -0.0050 | 0.0012 |
| 29/01/2021 | 0.0478 | 0.0202 | 0.0096 | -0.0170 | -0.0307 | 0.0020 | -0.0100 | 0.0255 | -0.0009 | 0.0226 | -0.0428 |
| 26/02/2021 | -0.0262 | -0.0450 | 0.0250 | -0.0282 | -0.0184 | -0.0802 | 0.0706 | 0.0038 | -0.0802 | 0.0515 | -0.0146 |
| 31/03/2021 | 0.0668 | 0.0274 | -0.0022 | 0.0243 | 0.0344 | -0.0267 | -0.0307 | 0.0587 | 0.0681 | 0.0429 | 0.0556 |
| 30/04/2021 | 0.0344 | -0.0237 | -0.0468 | 0.0287 | 0.0415 | 0.0979 | 0.0748 | 0.0304 | -0.0116 | 0.0320 | 0.0278 |
| 31/05/2021 | 0.0316 | 0.0237 | -0.0154 | 0.0347 | -0.0112 | -0.0910 | 0.0179 | 0.0206 | -0.0662 | 0.0565 | 0.0147 |
| 30/06/2021 | 0.0453 | 0.0543 | 0.0415 | 0.0214 | 0.0310 | 0.1236 | 0.0008 | 0.0563 | 0.0345 | -0.0018 | 0.0481 |
| 30/07/2021 | -0.0055 | 0.0150 | -0.0241 | 0.0111 | 0.0409 | -0.0636 | 0.0706 | -0.0148 | 0.0160 | -0.0142 | 0.0085 |
| 31/08/2021 | 0.0334 | 0.0679 | -0.0376 | 0.0662 | 0.0252 | 0.1619 | -0.0692 | 0.0550 | 0.0097 | 0.0492 | 0.0604 |
| 30/09/2021 | -0.0042 | -0.0358 | 0.1500 | -0.0476 | -0.0041 | -0.0370 | -0.0926 | 0.0128 | 0.0250 | 0.0155 | -0.0215 |
| 29/10/2021 | 0.0060 | -0.0231 | -0.0189 | 0.0087 | -0.0318 | 0.0243 | 0.0015 | -0.0087 | -0.0063 | 0.0083 | 0.0037 |
| 30/11/2021 | -0.0147 | 0.0413 | -0.0776 | 0.0148 | 0.0054 | -0.0111 | 0.0598 | 0.0466 | 0.0388 | -0.0690 | 0.0371 |
| 31/12/2021 | 0.0106 | -0.0228 | 0.0218 | -0.0221 | 0.0385 | -0.0579 | 0.0618 | 0.0071 | 0.0792 | 0.0426 | 0.0495 |
| 31/01/2022 | -0.0919 | -0.0958 | 0.0752 | -0.1213 | -0.0764 | -0.1709 | 0.0040 | -0.0796 | 0.0256 | -0.0660 | -0.0945 |
| 28/02/2022 | -0.0501 | 0.0536 | 0.0843 | -0.0024 | 0.0077 | -0.0684 | 0.0514 | -0.0213 | 0.0341 | 0.0300 | 0.0175 |
| 31/03/2022 | 0.0385 | 0.0444 | 0.1008 | 0.0254 | 0.0473 | 0.1175 | 0.0913 | 0.0496 | 0.0759 | 0.0851 | 0.0168 |
| 29/04/2022 | -0.0347 | 0.0336 | 0.0248 | 0.0233 | 0.0300 | -0.0986 | -0.0397 | -0.0023 | 0.0933 | 0.0004 | 0.0099 |
| 31/05/2022 | -0.0553 | -0.0655 | -0.0070 | -0.0119 | -0.0099 | -0.0795 | -0.0030 | -0.0674 | -0.0019 | -0.0225 | -0.0874 |
| 30/06/2022 | -0.0746 | 0.0022 | -0.0059 | -0.0324 | -0.0479 | -0.1116 | -0.1286 | -0.0393 | -0.0679 | -0.1191 | -0.1057 |
Question 4. Calculate the optimal portfolio for both investors that consists of all eleven industries. Compare this to the other portfolios in terms of diversification benefits. What do you observe? Contrast the differences in what you observe between the two investors.
Question 5. Now consider the case where both Boris and Angela can invest in a risk-free asset. The riskfree rate is 0.5% per month. Compare the diversification benefit between the five industry optimal portfolio in part 3 and the eleven industry optimal portfolio in part 4. How does the existence of the risk-free rate affect your conclusion regarding diversification benefits? Are diversification benefits increased or reduced if the investors can borrow or lend at the riskfree rate?
Industry Consumer Discretionary Consumer Staples Energy Health Care Industrials Information Technology Materials Telecom Utilities Financials Real Estate Abbreviation COND CONS ENGY HC INDU IT MATL TELE UTIL FIN RE Expected Return 0.75% 0.85% 0.78% 0.92% 0.72% 0.85% 0.91% 0.65% 0.69% 0.68% 0.70%
Step by Step Solution
3.50 Rating (147 Votes )
There are 3 Steps involved in it
To calculate the optimal portfolio for both investors we need to utilize the mean return standard deviation and risk aversion coefficient for each industry Since we have the expected returns for each ... View full answer

Get step-by-step solutions from verified subject matter experts