

Question: IP 8.6 CONTINEN) For the Years Ended 2011 2010 2009 Other relevant financial information Average common shares inued 29,610 29,100 28,800 Average long term delit
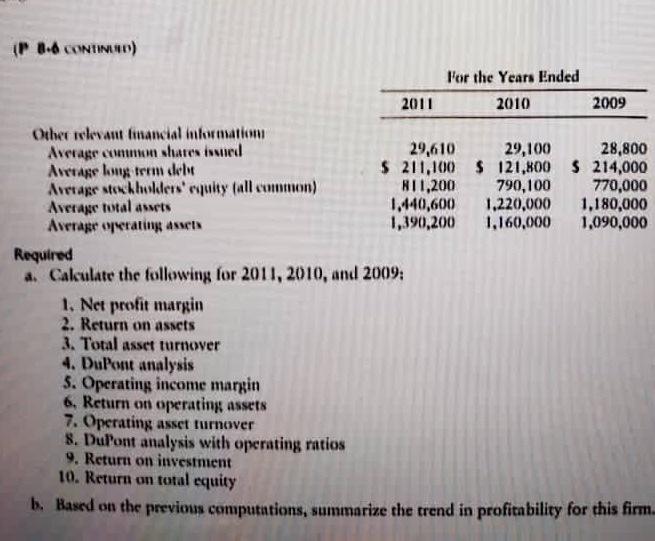
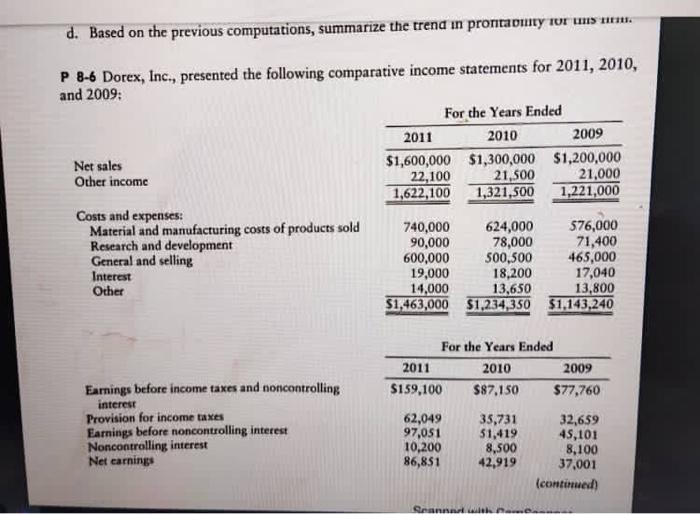
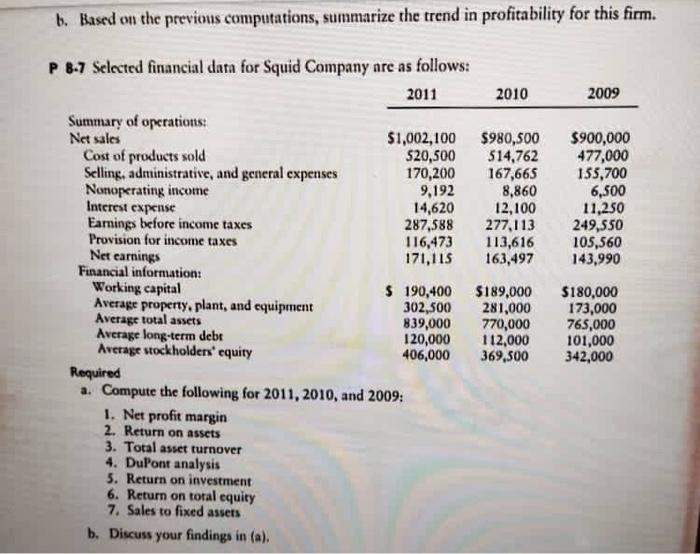
IP 8.6 CONTINEN) For the Years Ended 2011 2010 2009 Other relevant financial information Average common shares inued 29,610 29,100 28,800 Average long term delit $ 211,100 $ 121,800 $ 214,000 Average stockholders' equity fall common) RI1,200 790,100 770,000 Average total assets 1,440,600 1.220,000 1,180,000 Average operating asset 1,390,200 1,160,000 1,090,000 Required a Calculate the following for 2011, 2010, and 2009: 1. Net profit margin 2. Return on assets 3. Total asset turnover 4. DuPont analysis 3. Operating income margin 6. Return on operating assets 7. Operating asset turnover 8. Dul'ont analysis with operating ratios 9. Return on investment 10. Return on total equity b. Based on the previous computations, summarize the trend in profitability for this firm d. Based on the previous computations, summarize the trend in prontaputy Turism. P 8-6 Dorex, Inc., presented the following comparative income statements for 2011, 2010, and 2009: For the Years Ended 2011 2010 2009 Net sales $1,600,000 $1,300,000 $1,200,000 Other income 22,100 21,500 21,000 1,622,100 1,321,500 1,221,000 Costs and expenses: Material and manufacturing costs of products sold 740,000 624,000 576,000 Research and development 90,000 78,000 71,400 General and selling 600,000 500,500 465,000 Interest 19,000 18,200 17,040 Other 14,000 13,650 13,800 $1,463,000 $1,234,350 $1,143,240 Earnings before income taxes and noncontrolling interest Provision for income taxes Earnings before noncontrolling interest Noncontrolling interest Net earnings For the Years Ended 2011 2010 2009 $159,100 $87,150 $77,760 62,049 35,731 32,659 97,051 51,419 45,101 10,200 8,500 8,100 86,851 42,919 37,001 (continued Sonntek b. Based on the previous computations, summarize the trend in profitability for this firm. 2010 2009 $980,500 514,762 167,665 8,860 12,100 277,113 113,616 163,497 $900,000 477,000 155,700 6,500 11,250 249,550 105,560 143.990 P 8-7 Selected financial data for Squid Company are as follows: 2011 Summary of operations: Net sales $1,002,100 Cost of products sold 520,500 Selling, administrative, and general expenses 170,200 Nomoperating income 9,192 Interest expense 14,620 Earnings before income taxes 287,588 Provision for income taxes 116,473 Net earnings 171,115 Financial information: Working capital $ 190,400 Average property, plant, and equipment 302,500 Average total assets 839,000 Average long-term debe 120,000 Average stockholders' equity 406,000 Required a. Compute the following for 2011, 2010, and 2009: 1. Net profit margin 2. Return on assets 3. Total asset turnover 4. DuPont analysis 5. Return on investment 6. Return on total equity 7. Sales to fixed assets b. Discuss your findings in (a), $189,000 281,000 770,000 112,000 369,500 $180,000 173,000 765,000 101,000 342,000
Step by Step Solution
There are 3 Steps involved in it

Get step-by-step solutions from verified subject matter experts