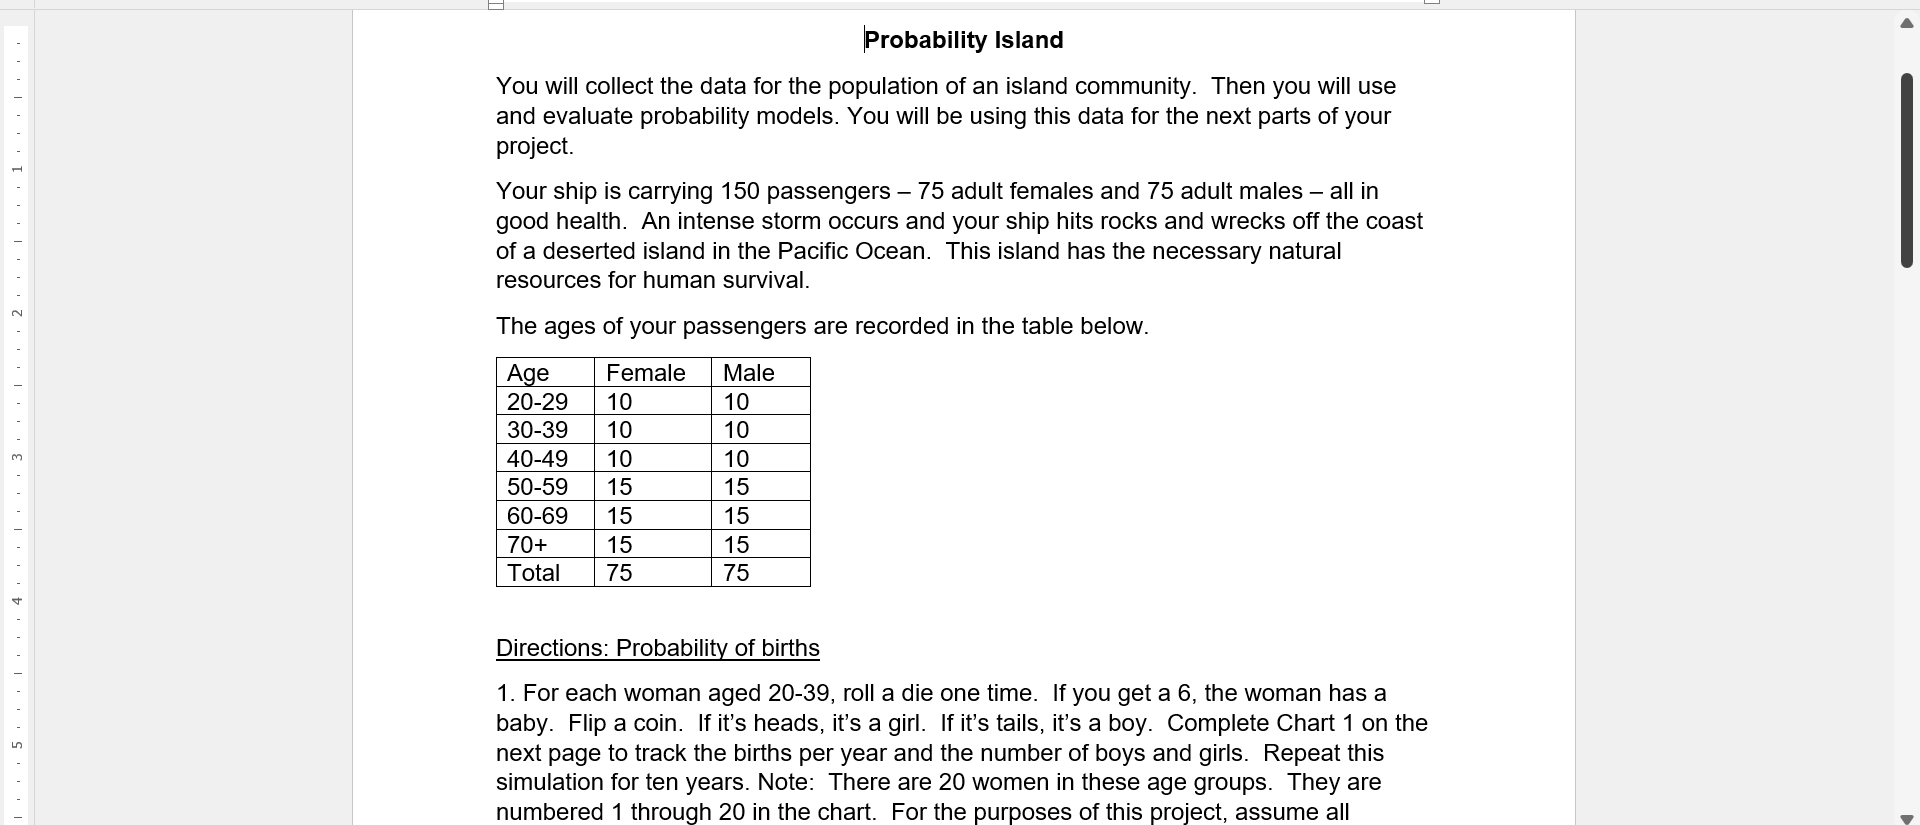
Question: iProbability Island You will collect the data for the population of an island community. Then you will use and evaluate probability models. You will be

iProbability Island You will collect the data foriProbability Island You will collect the data foriProbability Island You will collect the data foriProbability Island You will collect the data for
iProbability Island You will collect the data for the population of an island community. Then you will use and evaluate probability models. You will be using this data for the next parts of your project. Your ship is carrying 150 passengers 75 adult females and 75 adult males all in good health. An intense storm occurs and your ship hits rocks and wrecks off the coast of a deserted island in the Pacic Ocean. This island has the necessary natural resources for human survival. The ages of your passengers are recorded in the table below. Age Female Male 20-29 10 10 3039 10 10 4049 10 10 5059 15 15 6069 15 15 70+ 15 15 Total 75 75 Directions: Probabili of births 1. For each woman aged 2039, roll a die one time. If you get a 6, the woman has a baby. Flip a coin. If it's heads, it's a girl. If it's tails, it's a boy. Complete Chart 1 on the next page to track the births per year and the number of boys and girls. Repeat this simulation for ten years. Note: There are 20 women in these age groups. They are numbered 1 through 20 in the chart. For the purposes of this project, assume all B ' ' V \" V O Directions: Probabili of births 1. For each woman aged 20-39, roll a die one time. If you get a 6, the woman has a baby. Flip a coin. If it's heads, it's a girl. If it's tails, it's a boy. Complete Chart 1 on the next page to track the births per year and the number of boys and girls. Repeat this simulation for ten years. Note: There are 20 women in these age groups. They are numbered 1 through 20 in the chart. For the purposes ofthis project, assume all women in these age groups remain capable of having children; keep even/one in their assigned age groups. 2. Assuming the births occur as recorded, and that no one dies, what is the population of your island at the end of the ten-year period? Use Chart 2 to clearly show the population of your island at the end of each year. 3. a. Calculate the theoretical probability and the experimental probability of the births. Show your work. b. Compare the theoretical probability to the experimental probability. c. Discuss any similarities and/or differences. You may consider the annual or gender rates or any other possibility. Chart 1. Woman Year Year Year Year Year Year Year Year Year Year 10 (Om'xlmth-wad A O A A A N A b.) A A A U1 A 0') A \\1 A on A (.0 M O Total boys Total 17 18 19 20 Total boys Total girls Total Births Chart2 Year 10 Male 75 Female 75 Total

Step by Step Solution

There are 3 Steps involved in it

1 Expert Approved Answer
Step: 1 Unlock blur-text-image
Question Has Been Solved by an Expert!

Get step-by-step solutions from verified subject matter experts

Step: 2 Unlock
Step: 3 Unlock

Students Have Also Explored These Related Mathematics Questions!