

Question: Is 1.6 the correct interpretation? It is highlighted in yellow. 1. (25 points) Eisenhofer et al. (1999) investigated the use of plasma normetanephrine and metanephrine
Is 1.6 the correct interpretation? It is highlighted in yellow.
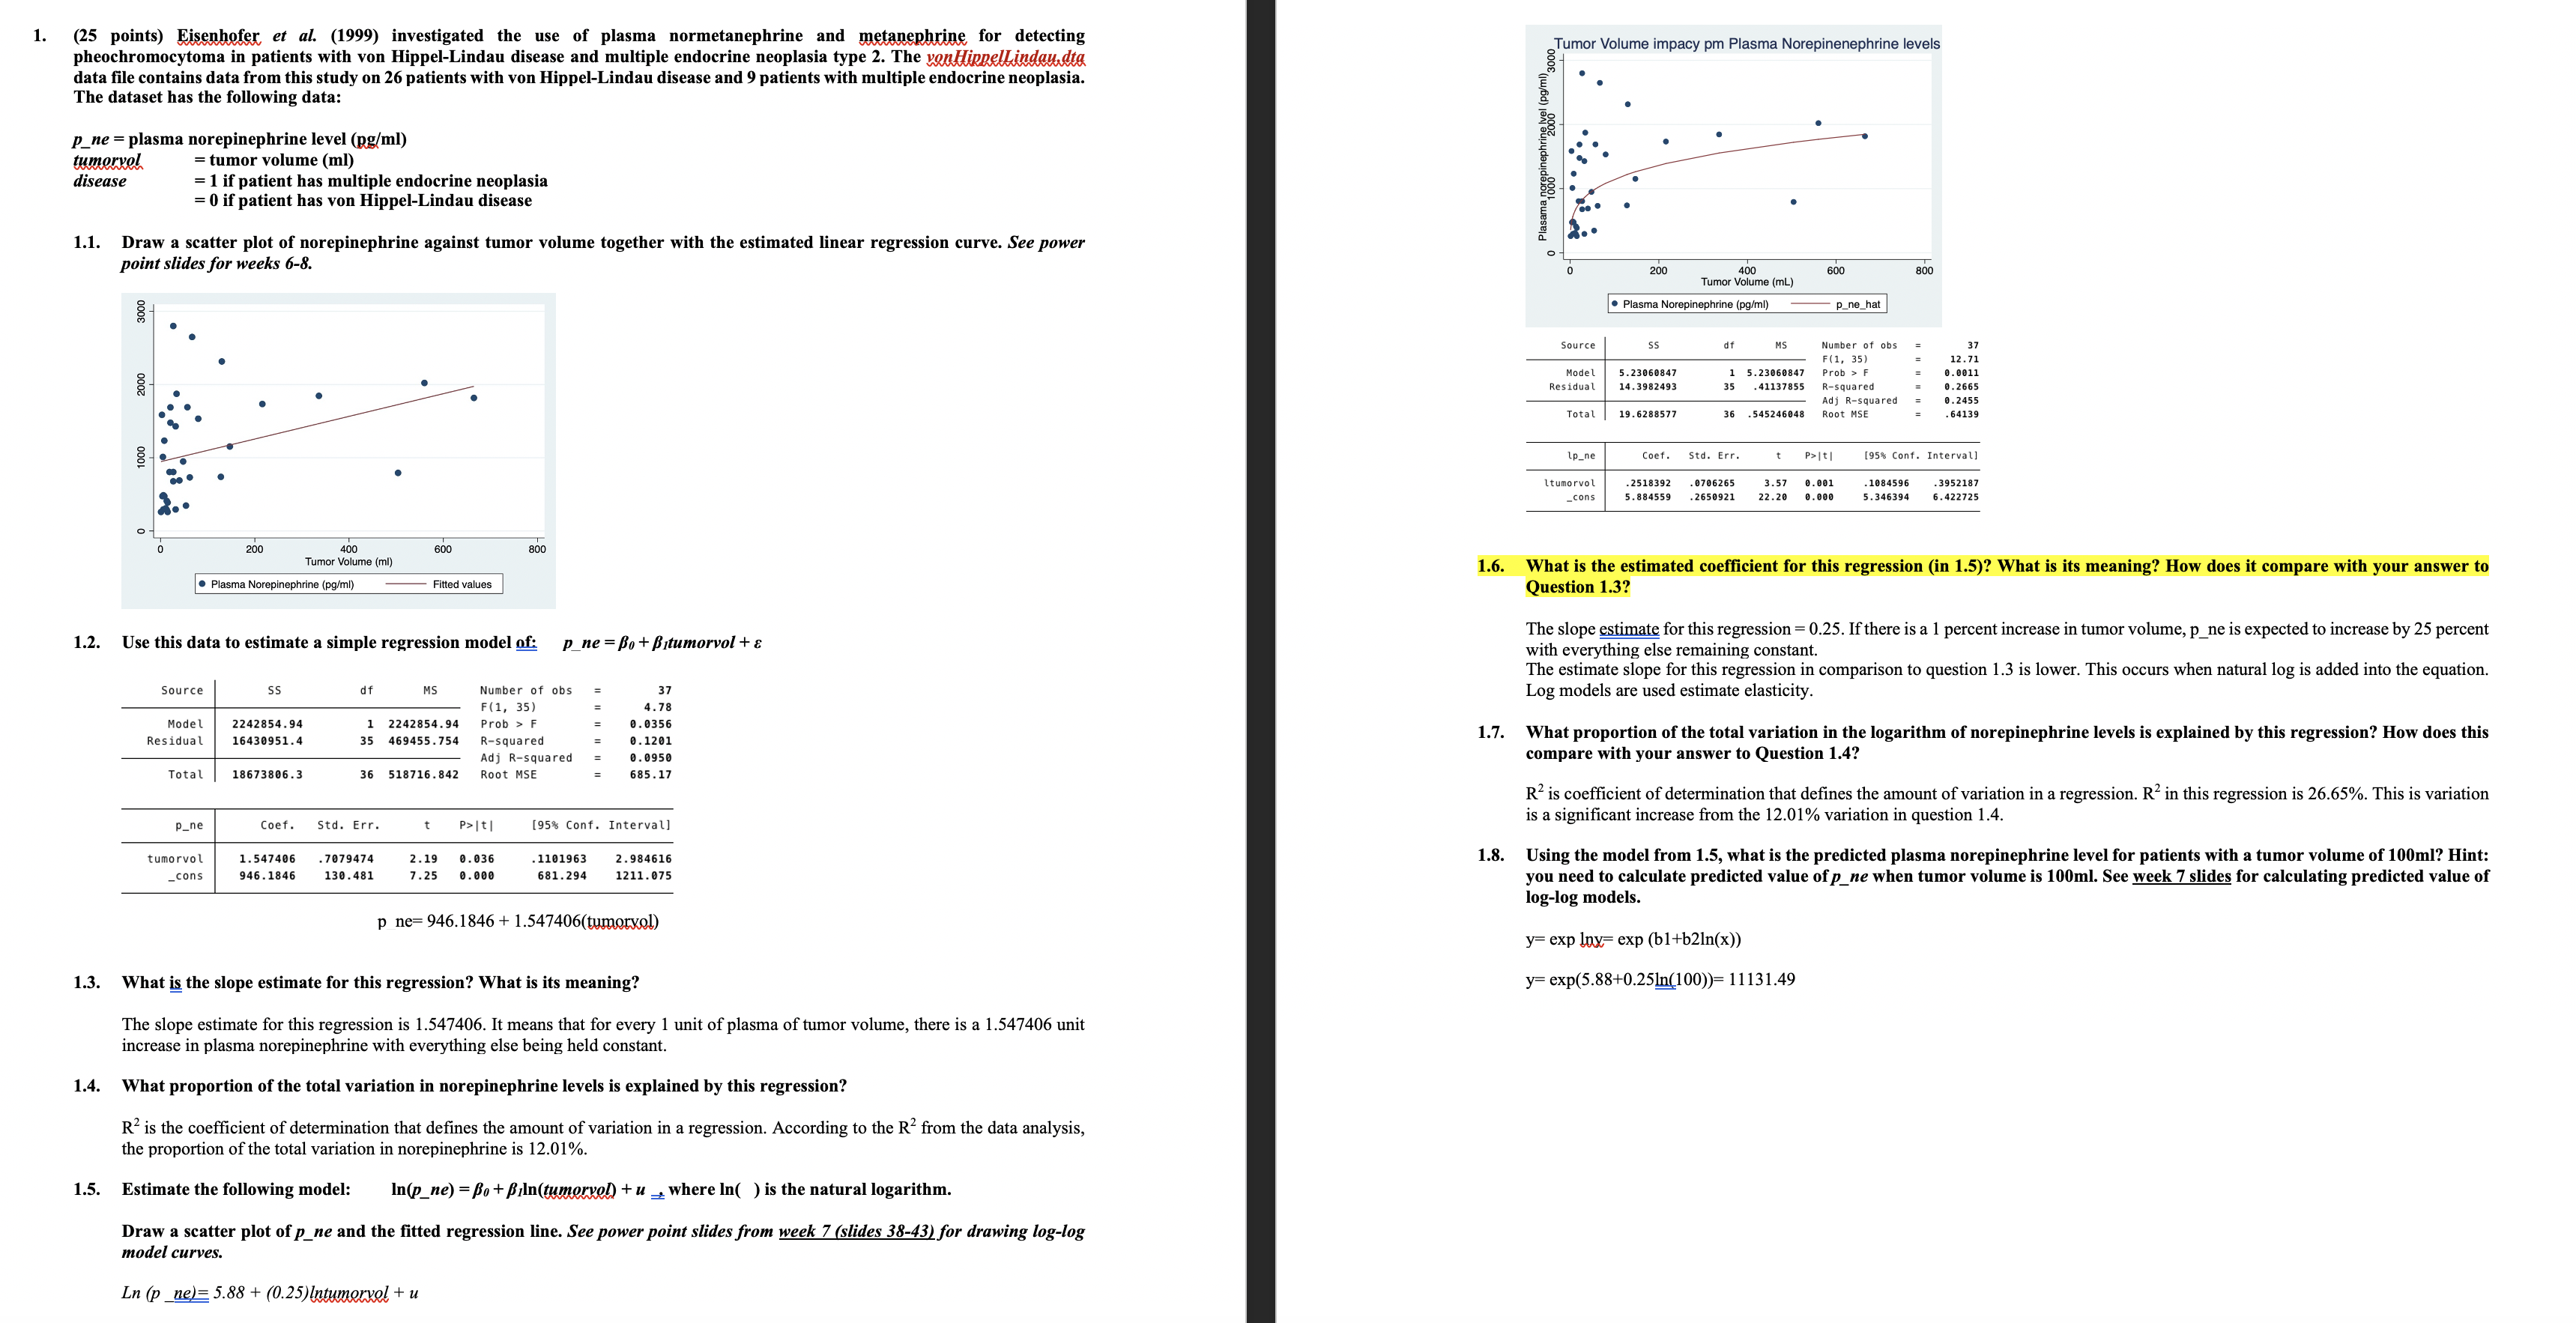
1. (25 points) Eisenhofer et al. (1999) investigated the use of plasma normetanephrine and metanephrine for detecting pheochromocytoma in patients with von Hippel-Lindau disease and multiple endocrine neoplasia type 2. The ventlipnellindeu dia Tumor Volume impacy pm Plasma Norepinenephrine levels data file contains data from this study on 26 patients with von Hippel-Lindau disease and 9 patients with multiple endocrine neoplasia. The dataset has the following data: p_ne = plasma norepinephrine level (pg/ml) tumorxol = tumor volume (ml) . . disease = 1 if patient has multiple endocrine neoplasia = 0 if patient has von Hippel-Lindau disease . . 1.1. Draw a scatter plot of norepinephrine against tumor volume together with the estimated linear regression curve. See power Plasama norepinephrineval (p9/3000_ point slides for weeks 6-8. 200 400 Tumor Volume (mL) 600 800 8 - . Plasma Norepinephrine (pg/ml) p_ne_hat Source SS of MS Number of obs 5.23060847 F (1, 35) 37 Model 14.3982493 5.23060847 Prob > F 12.71 200 Residual 5 .41137855 R-squared 0.0011 Adj R-squared 0.2665 82455 Total 19.6288577 36 . 545246048 Root MSE 64139 8 lp_ne Coef. Std. Err. t Palt| [95% Conf. Interval] tumorvol 0706265 1084596 3952187 cons .2518392 .884559 . 2650921 3.57 22.20 0.00 5.346394 6.422725 200 400 600 800 Tumor Volume (ml) 1.6. What is the estimated coefficient for this regression (in 1.5)? What is its meaning? How does it compare with your answer to . Plasma Norepinephrine (pg/ml) Fitted values Question 1.3? 1.2. Use this data to estimate a simple regression model of: p ne = Bo + Bitumorvol + & The slope estimate for this regression = 0.25. If there is a 1 percent increase in tumor volume, p_ne is expected to increase by 25 percent with everything else remaining constant The estimate slope for this regression in comparison to question 1.3 is lower. This occurs when natural log is added into the equation. Source of MS Number of obs 37 F (1, 35) Log models are used estimate elasticity. 4. 78 Model 2242854.94 1 2242854.94 Prob > 0. 0356 Residual 16430951.4 5 469455.754 R-squared 0. 1201 1.7. What proportion of the total variation in the logarithm of norepinephrine levels is explained by this regression? How does this Adj R-squared 0. 0956 compare with your answer to Question 1.4? Total 18673806.3 36 518716.842 Root MSE 685 . 17 R is coefficient of determination that defines the amount of variation in a regression. R in this regression is 26.65%. This is variation p_ne Coef. Std. Err. P>It [95% Conf. Interval] is a significant increase from the 12.01% variation in question 1.4. tumorvo 1.547406 0.03 946 . 1846 . 7079474 130 .481 2.19 0.000 1101963 2. 984616 1.8. Using the model from 1.5, what is the predicted plasma norepinephrine level for patients with a tumor volume of 100ml? Hint: _cons 7.25 681.294 1211.075 you need to calculate predicted value of p_ne when tumor volume is 100ml. See week 7 slides for calculating predicted value of log-log models. p ne= 946.1846 + 1.547406(tumorxol) y= exp loy= exp (61+b2In(x)) 1.3. What is the slope estimate for this regression? What is its meaning? y= exp(5.88+0.25In(100))= 11131.49 The slope estimate for this regression is 1.547406. It means that for every 1 unit of plasma of tumor volume, there is a 1.547406 unit increase in plasma norepinephrine with everything else being held constant. 1.4. What proportion of the total variation in norepinephrine levels is explained by this regression? R is the coefficient of determination that defines the amount of variation in a regression. According to the R from the data analysis, the proportion of the total variation in norepinephrine is 12.01% 1.5. Estimate the following model: In(p_ne) = Bo + Biln(tumorxeb) + u _ where In( ) is the natural logarithm. Draw a scatter plot of p_ne and the fitted regression line. See power point slides from week 7 (slides 38-43) for drawing log-log model curves. Ln (p ne)= 5.88 + (0.25) Intumorvel + u
Step by Step Solution
There are 3 Steps involved in it

Get step-by-step solutions from verified subject matter experts