

Question: Is just one question. 1 Required Information To complete this exercise, you wil need to download and install Tableau on your computer Tableau provides free
Is just one question.
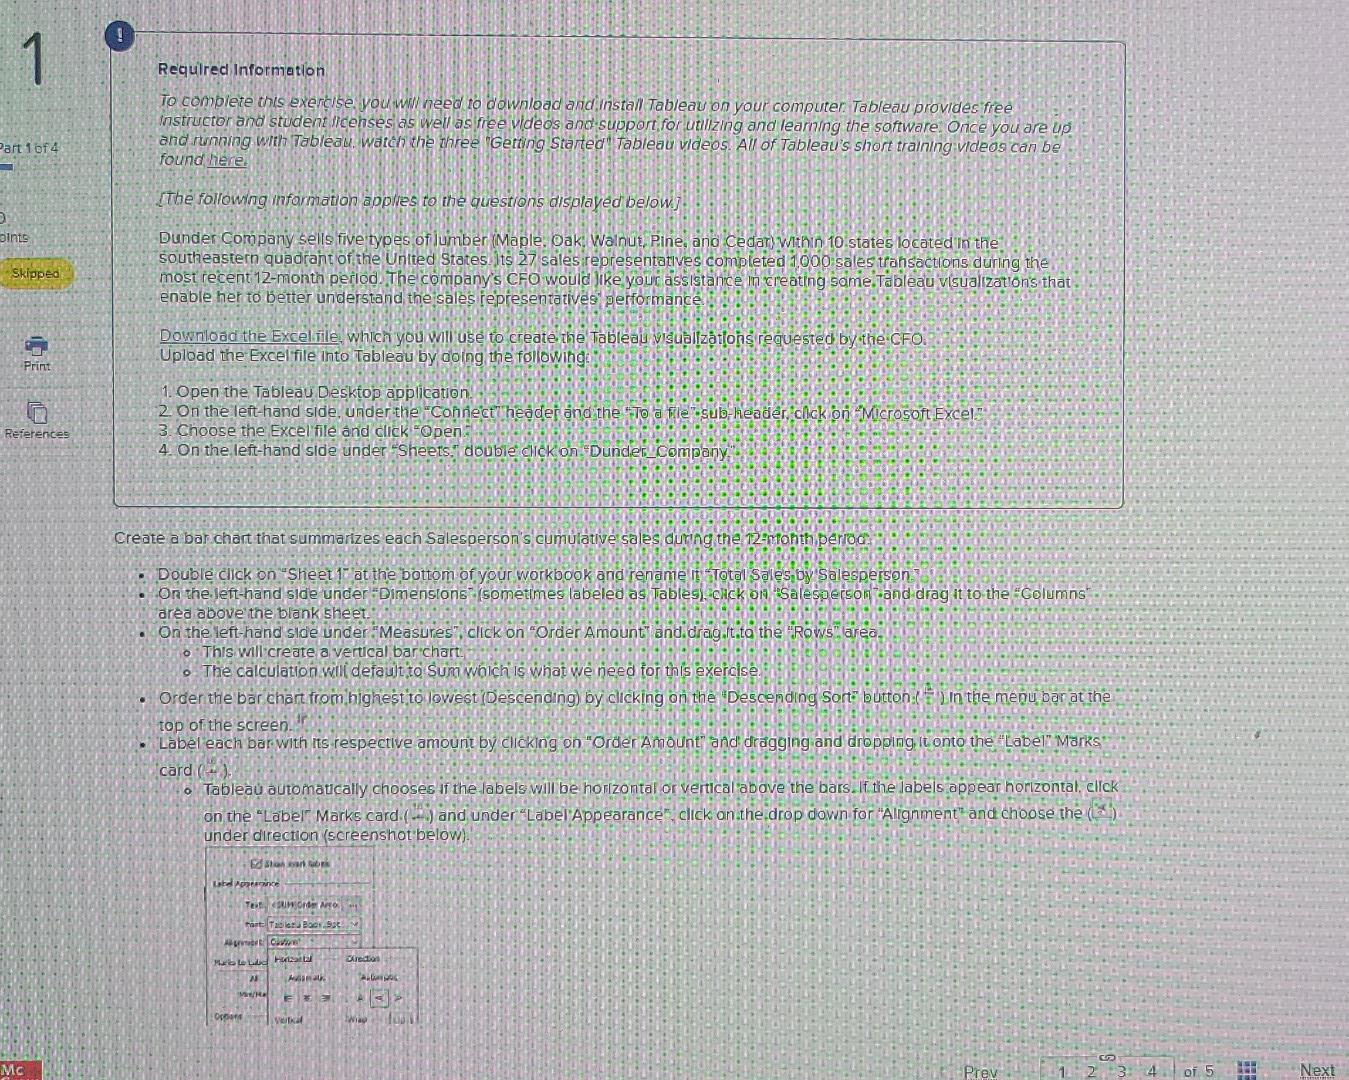
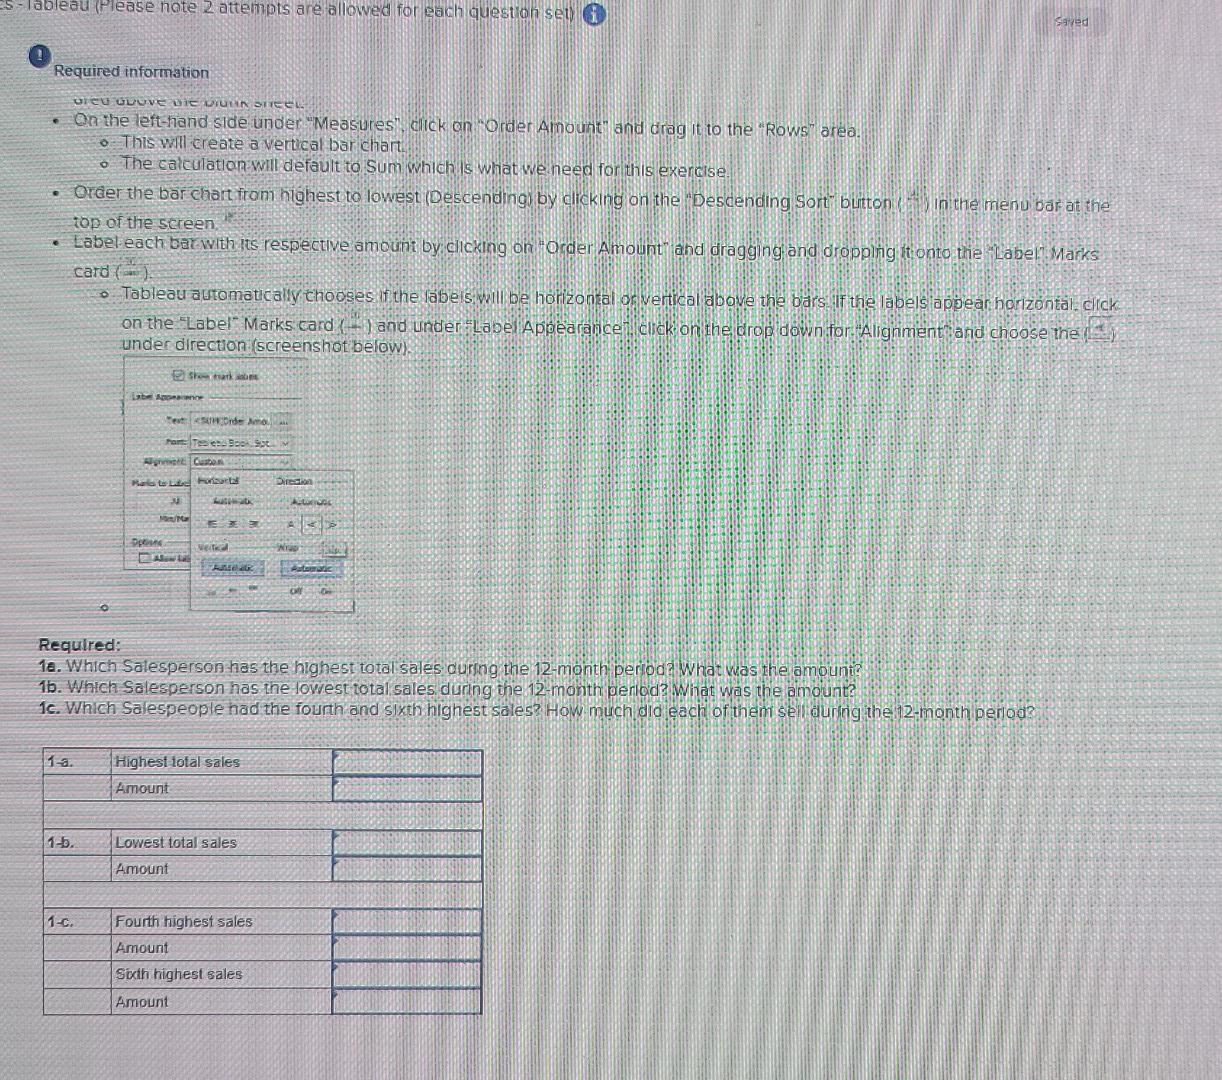
1 Required Information To complete this exercise, you wil need to download and install Tableau on your computer Tableau provides free Instructor and student licenses as well as free videos and support for utilizing and leaming the software. Once you are up and running with Tableau, watch the three Getting Started Tableau videos. All of Tableau's short training videos can be found here Part 1 of 4 The following information applies to the questions displayed below: pints Skippe Dunder Company sells five types of lumber (Maple. Oaki Walnut, Pine, ano Cedar) Within 10 states located in the southeastern quadrant of the United States )ts 27 sales representatives completed 1,000 sales transactions during the most recent 12-month period. The company's CFO would like your assistance in creating some. Tableau visualizations that enable her to better understand the sales representatives performance, TODO Download the Excel file, which you will use to create the Tableau visualizations requested by the CFO Upload the Excel file into Tableau by doing the following Print 1. Open the Tableau Desktop application 2. On the left-hand side, under the Connect header and the "To a filet-sub-header, chick on Microsoft Excel 3. Choose the Excel file and click Open 4. On the left-hand side under "Sheets. double click on "Dunder_company References Create a bar chart that summarizes each Salesperson's cumulative sales during the 12ertonth period Double click on "Sheet 1 at the bottom of your workbook and rename it Total Sales, by Salesperson On the left-hand side under Dimensions (sometimes labeled as Tables). Cick On Salesperson and drag it to the "Columns area above the blank sheet. 0000 On the left-hand side under Measures", click on "Order Amount" and.drag.lt to the "Rows" area. This will create a vertical bar chart. The calculation will default to Sum woich is what we need for this exercise. Order the bar chart from highest to lowest (Descending) by clicking on the Descending Sort button on the menu bar at the top of the screen. Label each bar with its respective amount by clicking on "Order Amount" and dragging and dropping it onto the "Labell Marks card () . Tableau automatically chooses if the labels will be horizontal or vertical above the bars. If the labels appear horizontal, click on the "Label Marks card (e) and under "Label Appearance click on the drop down for "Alignment" and choose the (2) under direction (screenshot below). darbs Ltd TO CRIME tant To Boost G Burada * A> Hubu walk Mc Prev 3 4 oi 5 Next es-lableau (Please note 2 attempts are allowed for each question set saved Required information DICU UVUV WIEDY Sne On the left-hand side under "Measures' lick on Order Amount and drag it to the "Rows area. o This will create a vertical bar chart. The calculation will default to Sum which is what we need for this exercise. Order the bar chart from highest to lowest (Descending by clicking on the "Desdending Sort" button in the menu bar at the top of the screen, Label each bar with its respective amount by clicking on "Order Amount" and dragging and dropping it onto the "Label Marks card (3) Tableau automatically chooses of the labels will be horizontal or vertical above the bars. If the labels appear horizontal.click on the "Label Marks card) and under "Label Appearance.click on the drop down for Alignment and choose they under direction screenshot below), Sharks be Terde AL hantee te ETCup Marte harta Direction 0 A. 3 Open NERD Roman Required: 18. Which Salesperson has the highest total sales during the 12-month period? What was the amounis 1b. Which Salesperson has the lowest total sales during the 12-month period? What was the amount? 1c. Which Salespeople had the fourth and sixth highest sales? How much did each of them sel during the 12-month period? 1 a. Highest total sales Amount 1-5. Lowest total sales Amount 1-c. Fourth highest sales Amount Sixth highest sales Amount 1 Required Information To complete this exercise, you wil need to download and install Tableau on your computer Tableau provides free Instructor and student licenses as well as free videos and support for utilizing and leaming the software. Once you are up and running with Tableau, watch the three Getting Started Tableau videos. All of Tableau's short training videos can be found here Part 1 of 4 The following information applies to the questions displayed below: pints Skippe Dunder Company sells five types of lumber (Maple. Oaki Walnut, Pine, ano Cedar) Within 10 states located in the southeastern quadrant of the United States )ts 27 sales representatives completed 1,000 sales transactions during the most recent 12-month period. The company's CFO would like your assistance in creating some. Tableau visualizations that enable her to better understand the sales representatives performance, TODO Download the Excel file, which you will use to create the Tableau visualizations requested by the CFO Upload the Excel file into Tableau by doing the following Print 1. Open the Tableau Desktop application 2. On the left-hand side, under the Connect header and the "To a filet-sub-header, chick on Microsoft Excel 3. Choose the Excel file and click Open 4. On the left-hand side under "Sheets. double click on "Dunder_company References Create a bar chart that summarizes each Salesperson's cumulative sales during the 12ertonth period Double click on "Sheet 1 at the bottom of your workbook and rename it Total Sales, by Salesperson On the left-hand side under Dimensions (sometimes labeled as Tables). Cick On Salesperson and drag it to the "Columns area above the blank sheet. 0000 On the left-hand side under Measures", click on "Order Amount" and.drag.lt to the "Rows" area. This will create a vertical bar chart. The calculation will default to Sum woich is what we need for this exercise. Order the bar chart from highest to lowest (Descending) by clicking on the Descending Sort button on the menu bar at the top of the screen. Label each bar with its respective amount by clicking on "Order Amount" and dragging and dropping it onto the "Labell Marks card () . Tableau automatically chooses if the labels will be horizontal or vertical above the bars. If the labels appear horizontal, click on the "Label Marks card (e) and under "Label Appearance click on the drop down for "Alignment" and choose the (2) under direction (screenshot below). darbs Ltd TO CRIME tant To Boost G Burada * A> Hubu walk Mc Prev 3 4 oi 5 Next es-lableau (Please note 2 attempts are allowed for each question set saved Required information DICU UVUV WIEDY Sne On the left-hand side under "Measures' lick on Order Amount and drag it to the "Rows area. o This will create a vertical bar chart. The calculation will default to Sum which is what we need for this exercise. Order the bar chart from highest to lowest (Descending by clicking on the "Desdending Sort" button in the menu bar at the top of the screen, Label each bar with its respective amount by clicking on "Order Amount" and dragging and dropping it onto the "Label Marks card (3) Tableau automatically chooses of the labels will be horizontal or vertical above the bars. If the labels appear horizontal.click on the "Label Marks card) and under "Label Appearance.click on the drop down for Alignment and choose they under direction screenshot below), Sharks be Terde AL hantee te ETCup Marte harta Direction 0 A. 3 Open NERD Roman Required: 18. Which Salesperson has the highest total sales during the 12-month period? What was the amounis 1b. Which Salesperson has the lowest total sales during the 12-month period? What was the amount? 1c. Which Salespeople had the fourth and sixth highest sales? How much did each of them sel during the 12-month period? 1 a. Highest total sales Amount 1-5. Lowest total sales Amount 1-c. Fourth highest sales Amount Sixth highest sales Amount
Step by Step Solution
There are 3 Steps involved in it

Get step-by-step solutions from verified subject matter experts