

Question: Please help with this question: Data Analytics -Tableau (Please note 2 attempts are al.. Saved Help Save & Exit Subu 3 Part 3 of 4
Please help with this question:
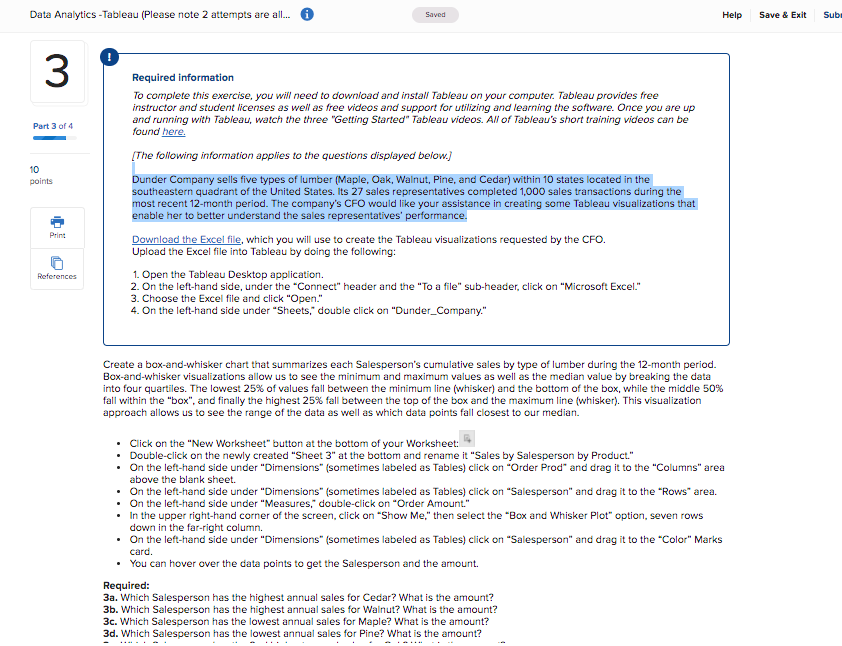
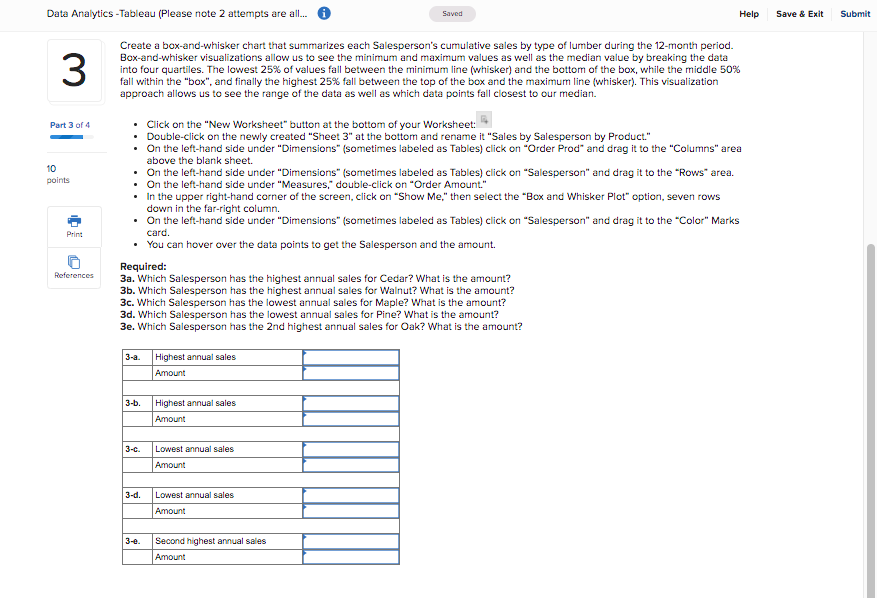
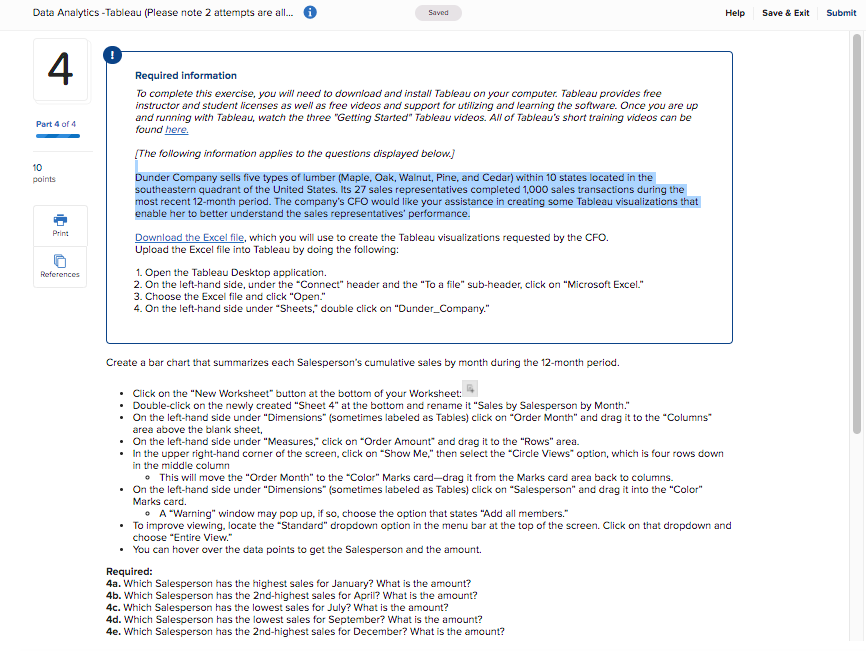
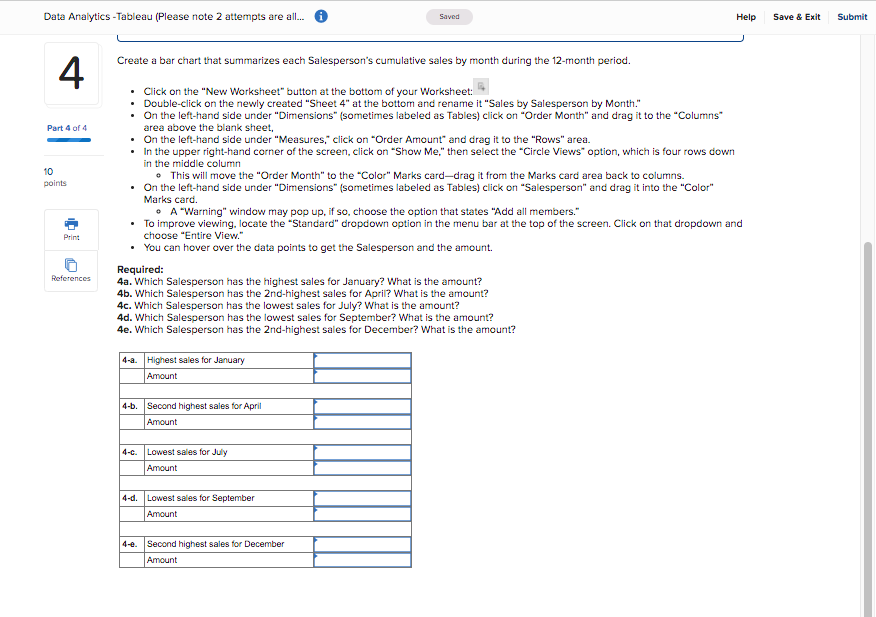
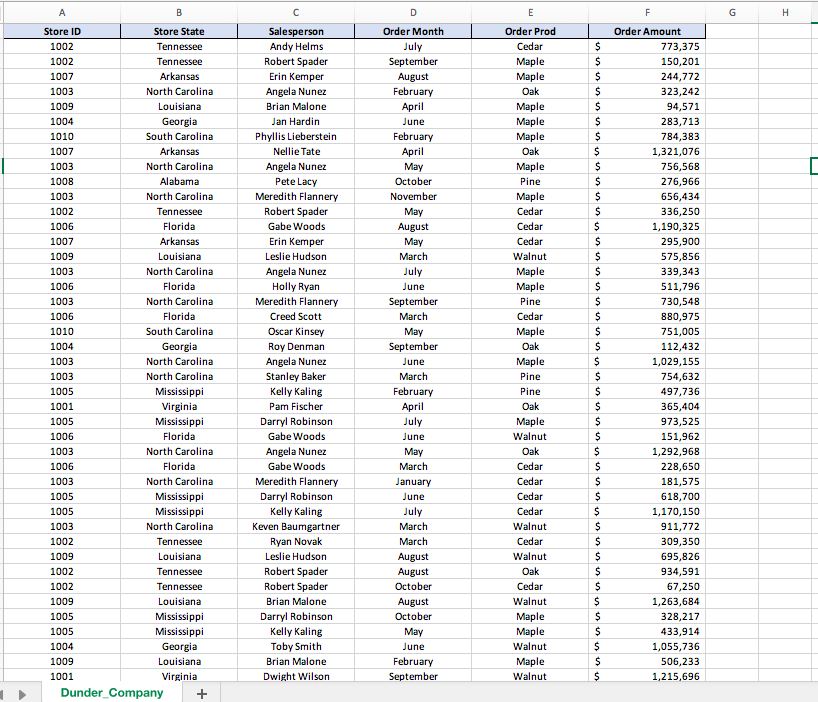
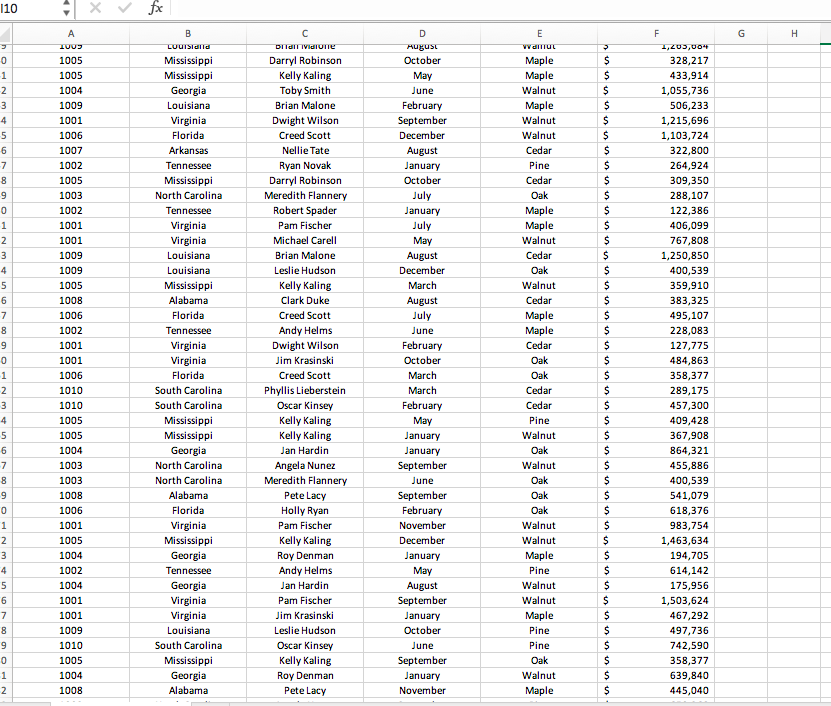
Data Analytics -Tableau (Please note 2 attempts are al.. Saved Help Save & Exit Subu 3 Part 3 of 4 10 points Required information To complete this exercise, you will need to download and install Tableau on your computer. Tableau provides free instructor and student licenses as well as free videos and support for utilizing and learning the software. Once you are up and running with Tableau, watch the three "Getting Started" Tableau videos. All of Tableau's short training videos can be found here. [The following information applies to the questions displayed below.) Dunder Company sells five types of lumber (Maple, Oak, Walnut, Pine, and Cedar) within 10 states located in the southeastern quadrant of the United States. Its 27 sales representatives completed 1,000 sales transactions during the most recent 12-month period. The company's CFO would like your assistance in creating some Tableau visualizations that enable her to better understand the sales representatives' performance. Download the Excel file, which you will use to create the Tableau visualizations requested by the CFO. Upload the Excel file into Tableau by doing the following: 1. Open the Tableau Desktop application. 2. On the left-hand side, under the "Connect" header and the "To a file" sub-header, click on "Microsoft Excel." 3. Choose the Excel file and click "Open." 4. On the left-hand side under "Sheets double click on "Dunder_Company." Print References Create a box-and-whisker chart that summarizes each Salesperson's cumulative sales by type of lumber during the 12-month period. Box-and-whisker visualizations allow us to see the minimum and maximum values as well as the median value by breaking the data into four quartiles. The lowest 25% of values fall between the minimum line (whisker) and the bottom of the box, while the middle 50% fall within the "box", and finally the highest 25% fall between the top of the box and the maximum line (whisker). This visualization approach allows us to see the range of the data as well as which data points fall closest to our median. . Click on the "New Worksheet" button at the bottom of your Worksheet: Double-click on the newly created "Sheet 3" at the bottom and rename it "Sales by Salesperson by Product." . On the left-hand side under "Dimensions" (sometimes labeled as Tables) click on "Order Prod" and drag it to the "Columns" area above the blank sheet. . On the left-hand side under "Dimensions" (sometimes labeled as Tables) click on "Salesperson" and drag it to the "Rows" area. . On the left-hand side under "Measures," double-click on "Order Amount." In the upper right-hand corner of the screen, click on "Show Me," then select the "Box and Whisker Plot" option, seven rows down in the far-right column. . On the left-hand side under "Dimensions" (sometimes labeled as Tables) click on "Salesperson" and drag it to the "Color" Marks card. . You can hover over the data points to get the Salesperson and the amount. Required: 3a. Which Salesperson has the highest annual sales for Cedar? What is the amount? 3b. Which Salesperson has the highest annual sales for Walnut? What is the amount? 3c. Which Salesperson has the lowest annual sales for Maple? What is the amount? 3d. Which Salesperson has the lowest annual sales for Pine? What is the amount? Data Analytics -Tableau (Please note 2 attempts are al... Saved Help Save & Exit Submit 3 Create a box-and-whisker chart that summarizes each Salesperson's cumulative sales by type of lumber during the 12-month period. Box-and-whisker visualizations allow us to see the minimum and maximum values as well as the median value by breaking the data into four quartiles. The lowest 25% of values fall between the minimum line (whisker) and the bottom of the box, while the middle 50% fall within the "box", and finally the highest 25% fall between the top of the box and the maximum line (whisker). This visualization approach allows us to see the range of the data as well as which data points fall closest to our median. Part 3 of 4 10 points Click on the "New Worksheet" button at the bottom of your Worksheet: Double-click on the newly created "Sheet 3" at the bottom and rename it "Sales by Salesperson by Product." . On the left-hand side under "Dimensions" (sometimes labeled as Tables) click on "Order Prod" and drag it to the "Columns" area above the blank sheet. . On the left-hand side under "Dimensions" (sometimes labeled as Tables) click on "Salesperson" and drag it to the "Rows" area. . On the left-hand side under "Measures, double-click on "Order Amount." In the upper right-hand corner of the screen, click on "Show Me" then select the "Box and Whisker Plot" option, seven rows down in the far-right column. . On the left-hand side under "Dimensions" (sometimes labeled as Tables) click on "Salesperson" and drag it to the "Color" Marks You can hover over the data points to get the Salesperson and the amount. Required: 3a. Which Salesperson has the highest annual sales for Cedar? What is the amount? 3b. Which Salesperson has the highest annual sales for Walnut? What is the amount? 3c. Which Salesperson has the lowest annual sales for Maple? What is the amount? 3d. Which Salesperson has the lowest annual sales for Pine? What is the amount? 3e. Which Salesperson has the 2nd highest annual sales for Oak? What is the amount? Print card. References 3-a. Highest annual sales Amount 3-b. Highest annual sales Amount 3-c. Lowest annual sales Amount 3-d. Lowest annual sales Amount 3-e. Second highest annual sales Amount Data Analytics -Tableau (Please note 2 attempts are al... Saved Help Save & Exit Submit 4. Part 4 of 4 10 points Required information To complete this exercise, you will need to download and install Tableau on your computer. Tableau provides free instructor and student licenses as well as free videos and support for utilizing and learning the software. Once you are up and running with Tableau, watch the three "Getting Started" Tableau videos. All of Tableau's short training videos can be found here. (The following information applies to the questions displayed below) Dunder Company sells five types of lumber (Maple, Oak, Walnut, Pine, and Cedar) within 10 states located in the southeastern quadrant of the United States. Its 27 sales representatives completed 1,000 sales transactions during the most recent 12-month period. The company's CFO would like your assistance in creating some Tableau visualizations that enable her to better understand the sales representatives' performance. Download the Excel file, which you will use to create the Tableau visualizations requested by the CFO. Upload the Excel file into Tableau by doing the following: 1. Open the Tableau Desktop application. 2. On the left-hand side, under the "Connect" header and the "To a file" sub-header, click on Microsoft Excel." 3. Choose the Excel file and click "Open." 4. On the left-hand side under "Sheets," double click on "Dunder_Company." Print References Create a bar chart that summarizes each Salesperson's cumulative sales by month during the 12-month period. . Click on the "New Worksheet" button at the bottom of your Worksheet: Double-click on the newly created "Sheet 4" at the bottom and rename it "Sales by Salesperson by Month." . On the left-hand side under "Dimensions" (sometimes labeled as Tables) click on "Order Month" and drag it to the "Columns area above the blank sheet, . On the left-hand side under "Measures, click on "Order Amount" and drag it to the "Rows" area. In the upper right-hand corner of the screen, click on "Show Me" then select the "Circle Views" option, which is four rows down in the middle column This will move the "Order Month" to the "Color" Marks card-drag it from the Marks card area back to columns. . On the left-hand side under "Dimensions" (sometimes labeled as Tables) click on "Salesperson" and drag it into the "Color" Marks card. A "Warning" window may pop up, if so, choose the option that states "Add all members." To improve viewing, locate the "Standard" dropdown option in the menu bar at the top of the screen. Click on that dropdown and choose "Entire View." You can hover over the data points to get the Salesperson and the amount. Required: 4a. Which Salesperson has the highest sales for January? What is the amount? 4b. Which Salesperson has the 2nd-highest sales for April? What is the amount? 4. Which Salesperson has the lowest sales for July? What is the amount? 4d. Which Salesperson has the lowest sales for September? What is the amount? 4e. Which Salesperson has the 2nd-highest sales for December? What is the amount? Data Analytics -Tableau (Please note 2 attempts are al... Saved Help Save & Exit Submit Create a bar chart that summarizes each Salesperson's cumulative sales by month during the 12-month period. 4 Part 4 of 4 10 points Click on the New Worksheet" button at the bottom of your Worksheet: Double-click on the newly created "Sheet 4" at the bottom and rename it "Sales by Salesperson by Month." . On the left-hand side under "Dimensions" (sometimes labeled as Tables) click on "Order Month" and drag it to the "Columns area above the blank sheet, . On the left-hand side under "Measures" click on "Order Amount and drag it to the "Rows" area. . In the upper right-hand corner of the screen, click on "Show Me," then select the "Circle Views" option, which is four rows down in the middle column This will move the "Order Month" to the "Color" Marks carddrag it from the Marks card area back to columns. . On the left-hand side under "Dimensions" (sometimes labeled as Tables) click on "Salesperson" and drag it into the "Color" Marks card. - A Warning" window may pop up, if so, choose the option that states "Add all members." To improve viewing. locate the "Standard" dropdown option in the menu bar at the top of the screen. Click on that dropdown and choose "Entire View." You can hover over the data points to get the Salesperson and the amount. Required: 4a. Which Salesperson has the highest sales for January? What is the amount? 4b. Which Salesperson has the 2nd-highest sales for April? What is the amount? 4c. Which Salesperson has the lowest sales for July? What is the amount? 4d. Which Salesperson has the lowest sales for September? What is the amount? 4e. Which Salesperson has the 2nd-highest sales for December? What is the amount? Print References 4-a. Highest sales for January Amount 4-6. Second highest sales for April Amount 4-c. Lowest sales for July Amount 4-d. Lowest sales for September Amount 4-6. Second highest sales for December Amount A B D E F G H Store ID Store State 1002 Tennessee 1002 Tennessee 1007 Arkansas 1003 North Carolina 1009 Louisiana 1004 Georgia 1010 South Carolina 1007 Arkansas 1003 North Carolina 1008 Alabama 1003 North Carolina 1002 Tennessee 1006 Florida 1007 Arkansas 1009 Louisiana 1003 North Carolina 1006 Florida 1003 North Carolina 1006 Florida 1010 South Carolina 1004 Georgia 1003 North Carolina 1003 North Carolina 1005 Mississippi 1001 Virginia 1005 Mississippi 1006 Florida 1003 North Carolina 1006 Florida 1003 North Carolina 1005 Mississippi 1005 Mississippi 1003 North Carolina 1002 Tennessee 1009 Louisiana 1002 Tennessee 1002 Tennessee 1009 Louisiana 1005 Mississippi 1005 Mississippi 1004 Georgia 1009 Louisiana 1001 Virginia Dunder Company + Salesperson Andy Helms Robert Spader Erin Kemper Angela Nunez Brian Malone Jan Hardin Phyllis Lieberstein Nellie Tate Angela Nunez Pete Lacy Meredith Flannery Robert Spader Gabe Woods Erin Kemper Leslie Hudson Angela Nunez Holly Ryan Meredith Flannery Creed Scott Oscar Kinsey Roy Denman Angela Nunez Stanley Baker Kelly Kaling Pam Fischer Darryl Robinson Gabe Woods Angela Nunez Gabe Woods Meredith Flannery Darryl Robinson Kelly Kaling Keven Baumgartner Ryan Novak Leslie Hudson Robert Spader Robert Spader Brian Malone Darryl Robinson Kelly Kaling Toby Smith Brian Malone Dwight Wilson Order Month July September August February April June February April May October November May August May March July June September March May September June March February April July June May March January June July March March August August October August October May June February September Order Prod Cedar Maple Maple Oak Maple Maple Maple Oak Maple Pine Maple Cedar Cedar Cedar Walnut Maple Maple Pine Cedar Maple Oak Maple Pine Pine Oak Maple Walnut Oak Cedar Cedar Cedar Cedar Walnut Cedar Walnut Oak Cedar Walnut Maple Maple Walnut Maple Walnut $ $ $ $ $ $ $ $ $ $ $ $ $ $ $ $ $ $ $ $ $ $ $ $ $ $ $ $ $ $ $ $ $ $ $ $ $ $ $ $ $ $ $ Order Amount 773,375 150,201 244,772 323,242 94,571 283,713 784,383 1,321,076 756,568 276,966 656,434 336,250 1,190,325 295,900 575,856 339,343 511,796 730,548 880,975 751,005 112,432 1,029,155 754,632 497,736 365,404 973,525 1,962 1,292,968 228,650 181,575 618,700 1,170,150 911,772 309,350 695,826 934,591 67,250 1,263,684 328,217 433,914 1,055,736 506,233 1,215,696 110 fx A G H TUU > $ $ $ 0 1 2 3 4 5 6 7 8 9 $ $ 00 ONM $ $ $ $ $ $ $ $ $ 1 2 3 4 5 6 7 8 9 0 1 2 3 4 5 6 7 8 9 1005 1005 1004 1009 1001 1006 1007 1002 1005 1003 1002 1001 1001 1009 1009 1005 1008 1006 1002 1001 1001 1006 1010 1010 1005 1005 1004 1003 1003 1008 1006 1001 1005 1004 1002 1004 1001 1001 1009 1010 1005 1004 1008 B LUUTSalla Mississippi Mississippi Georgia Louisiana Virginia Florida Arkansas Tennessee Mississippi North Carolina Tennessee Virginia Virginia Louisiana Louisiana Mississippi Alabama Florida Tennessee Virginia Virginia Florida South Carolina South Carolina Mississippi Mississippi Georgia North Carolina North Carolina Alabama Florida Virginia Mississippi Georgia Tennessee Georgia Virginia Virginia Louisiana South Carolina Mississippi Georgia Alabama DITAI Vidiure Darryl Robinson Kelly Kaling Toby Smith Brian Malone Dwight Wilson Creed Scott Nellie Tate Ryan Novak Darryl Robinson Meredith Flannery Robert Spader Pam Fischer Michael Carell Brian Malone Leslie Hudson Kelly Kaling Clark Duke Creed Scott Andy Helms Dwight Wilson Jim Krasinski Creed Scott Phyllis Lieberstein Oscar Kinsey Kelly Kaling Kelly Kaling Jan Hardin Angela Nunez Meredith Flannery Pete Lacy Holly Ryan Pam Fischer Kelly Kaling Roy Denman Andy Helms Jan Hardin Pam Fischer Jim Krasinski Leslie Hudson Oscar Kinsey Kelly Kaling Roy Denman Pete Lacy D Hugust October May June February September December August January October July January July May August December March August July June February October March March February May January January September June September February November December January May August September January October June September January November E VITTUL Maple Maple Walnut Maple Walnut Walnut Cedar Pine Cedar Oak Maple Maple Walnut Cedar Oak Walnut Cedar Maple Maple Cedar Oak Oak Cedar Cedar Pine Walnut Oak Walnut Oak Oak Oak Walnut Walnut Maple Pine Walnut Walnut Maple Pine Pine Oak Walnut Maple is in si in si s nisi s sin siis $ $ $ $ $ $ $ F 1,203,00 328,217 433,914 1,055,736 506,233 1,215,696 1,103,724 322,800 264,924 309,350 288,107 122,386 406,099 767,808 1,250,850 400,539 359,910 383,325 495,107 228,083 127,775 484,863 358,377 289,175 457,300 409,428 367,908 864,321 455,886 400,539 541,079 618,376 983,754 1,463,634 194,705 614,142 175,956 1,503,624 467,292 497,736 742,590 358,377 639,840 445,040 $ $ $ $ $ $ 00 ONM $ $ 1 2 3 4 5 6 7 8 9 0 1 2 $ $ $ $ $ $ $ $ Data Analytics -Tableau (Please note 2 attempts are al.. Saved Help Save & Exit Subu 3 Part 3 of 4 10 points Required information To complete this exercise, you will need to download and install Tableau on your computer. Tableau provides free instructor and student licenses as well as free videos and support for utilizing and learning the software. Once you are up and running with Tableau, watch the three "Getting Started" Tableau videos. All of Tableau's short training videos can be found here. [The following information applies to the questions displayed below.) Dunder Company sells five types of lumber (Maple, Oak, Walnut, Pine, and Cedar) within 10 states located in the southeastern quadrant of the United States. Its 27 sales representatives completed 1,000 sales transactions during the most recent 12-month period. The company's CFO would like your assistance in creating some Tableau visualizations that enable her to better understand the sales representatives' performance. Download the Excel file, which you will use to create the Tableau visualizations requested by the CFO. Upload the Excel file into Tableau by doing the following: 1. Open the Tableau Desktop application. 2. On the left-hand side, under the "Connect" header and the "To a file" sub-header, click on "Microsoft Excel." 3. Choose the Excel file and click "Open." 4. On the left-hand side under "Sheets double click on "Dunder_Company." Print References Create a box-and-whisker chart that summarizes each Salesperson's cumulative sales by type of lumber during the 12-month period. Box-and-whisker visualizations allow us to see the minimum and maximum values as well as the median value by breaking the data into four quartiles. The lowest 25% of values fall between the minimum line (whisker) and the bottom of the box, while the middle 50% fall within the "box", and finally the highest 25% fall between the top of the box and the maximum line (whisker). This visualization approach allows us to see the range of the data as well as which data points fall closest to our median. . Click on the "New Worksheet" button at the bottom of your Worksheet: Double-click on the newly created "Sheet 3" at the bottom and rename it "Sales by Salesperson by Product." . On the left-hand side under "Dimensions" (sometimes labeled as Tables) click on "Order Prod" and drag it to the "Columns" area above the blank sheet. . On the left-hand side under "Dimensions" (sometimes labeled as Tables) click on "Salesperson" and drag it to the "Rows" area. . On the left-hand side under "Measures," double-click on "Order Amount." In the upper right-hand corner of the screen, click on "Show Me," then select the "Box and Whisker Plot" option, seven rows down in the far-right column. . On the left-hand side under "Dimensions" (sometimes labeled as Tables) click on "Salesperson" and drag it to the "Color" Marks card. . You can hover over the data points to get the Salesperson and the amount. Required: 3a. Which Salesperson has the highest annual sales for Cedar? What is the amount? 3b. Which Salesperson has the highest annual sales for Walnut? What is the amount? 3c. Which Salesperson has the lowest annual sales for Maple? What is the amount? 3d. Which Salesperson has the lowest annual sales for Pine? What is the amount? Data Analytics -Tableau (Please note 2 attempts are al... Saved Help Save & Exit Submit 3 Create a box-and-whisker chart that summarizes each Salesperson's cumulative sales by type of lumber during the 12-month period. Box-and-whisker visualizations allow us to see the minimum and maximum values as well as the median value by breaking the data into four quartiles. The lowest 25% of values fall between the minimum line (whisker) and the bottom of the box, while the middle 50% fall within the "box", and finally the highest 25% fall between the top of the box and the maximum line (whisker). This visualization approach allows us to see the range of the data as well as which data points fall closest to our median. Part 3 of 4 10 points Click on the "New Worksheet" button at the bottom of your Worksheet: Double-click on the newly created "Sheet 3" at the bottom and rename it "Sales by Salesperson by Product." . On the left-hand side under "Dimensions" (sometimes labeled as Tables) click on "Order Prod" and drag it to the "Columns" area above the blank sheet. . On the left-hand side under "Dimensions" (sometimes labeled as Tables) click on "Salesperson" and drag it to the "Rows" area. . On the left-hand side under "Measures, double-click on "Order Amount." In the upper right-hand corner of the screen, click on "Show Me" then select the "Box and Whisker Plot" option, seven rows down in the far-right column. . On the left-hand side under "Dimensions" (sometimes labeled as Tables) click on "Salesperson" and drag it to the "Color" Marks You can hover over the data points to get the Salesperson and the amount. Required: 3a. Which Salesperson has the highest annual sales for Cedar? What is the amount? 3b. Which Salesperson has the highest annual sales for Walnut? What is the amount? 3c. Which Salesperson has the lowest annual sales for Maple? What is the amount? 3d. Which Salesperson has the lowest annual sales for Pine? What is the amount? 3e. Which Salesperson has the 2nd highest annual sales for Oak? What is the amount? Print card. References 3-a. Highest annual sales Amount 3-b. Highest annual sales Amount 3-c. Lowest annual sales Amount 3-d. Lowest annual sales Amount 3-e. Second highest annual sales Amount Data Analytics -Tableau (Please note 2 attempts are al... Saved Help Save & Exit Submit 4. Part 4 of 4 10 points Required information To complete this exercise, you will need to download and install Tableau on your computer. Tableau provides free instructor and student licenses as well as free videos and support for utilizing and learning the software. Once you are up and running with Tableau, watch the three "Getting Started" Tableau videos. All of Tableau's short training videos can be found here. (The following information applies to the questions displayed below) Dunder Company sells five types of lumber (Maple, Oak, Walnut, Pine, and Cedar) within 10 states located in the southeastern quadrant of the United States. Its 27 sales representatives completed 1,000 sales transactions during the most recent 12-month period. The company's CFO would like your assistance in creating some Tableau visualizations that enable her to better understand the sales representatives' performance. Download the Excel file, which you will use to create the Tableau visualizations requested by the CFO. Upload the Excel file into Tableau by doing the following: 1. Open the Tableau Desktop application. 2. On the left-hand side, under the "Connect" header and the "To a file" sub-header, click on Microsoft Excel." 3. Choose the Excel file and click "Open." 4. On the left-hand side under "Sheets," double click on "Dunder_Company." Print References Create a bar chart that summarizes each Salesperson's cumulative sales by month during the 12-month period. . Click on the "New Worksheet" button at the bottom of your Worksheet: Double-click on the newly created "Sheet 4" at the bottom and rename it "Sales by Salesperson by Month." . On the left-hand side under "Dimensions" (sometimes labeled as Tables) click on "Order Month" and drag it to the "Columns area above the blank sheet, . On the left-hand side under "Measures, click on "Order Amount" and drag it to the "Rows" area. In the upper right-hand corner of the screen, click on "Show Me" then select the "Circle Views" option, which is four rows down in the middle column This will move the "Order Month" to the "Color" Marks card-drag it from the Marks card area back to columns. . On the left-hand side under "Dimensions" (sometimes labeled as Tables) click on "Salesperson" and drag it into the "Color" Marks card. A "Warning" window may pop up, if so, choose the option that states "Add all members." To improve viewing, locate the "Standard" dropdown option in the menu bar at the top of the screen. Click on that dropdown and choose "Entire View." You can hover over the data points to get the Salesperson and the amount. Required: 4a. Which Salesperson has the highest sales for January? What is the amount? 4b. Which Salesperson has the 2nd-highest sales for April? What is the amount? 4. Which Salesperson has the lowest sales for July? What is the amount? 4d. Which Salesperson has the lowest sales for September? What is the amount? 4e. Which Salesperson has the 2nd-highest sales for December? What is the amount? Data Analytics -Tableau (Please note 2 attempts are al... Saved Help Save & Exit Submit Create a bar chart that summarizes each Salesperson's cumulative sales by month during the 12-month period. 4 Part 4 of 4 10 points Click on the New Worksheet" button at the bottom of your Worksheet: Double-click on the newly created "Sheet 4" at the bottom and rename it "Sales by Salesperson by Month." . On the left-hand side under "Dimensions" (sometimes labeled as Tables) click on "Order Month" and drag it to the "Columns area above the blank sheet, . On the left-hand side under "Measures" click on "Order Amount and drag it to the "Rows" area. . In the upper right-hand corner of the screen, click on "Show Me," then select the "Circle Views" option, which is four rows down in the middle column This will move the "Order Month" to the "Color" Marks carddrag it from the Marks card area back to columns. . On the left-hand side under "Dimensions" (sometimes labeled as Tables) click on "Salesperson" and drag it into the "Color" Marks card. - A Warning" window may pop up, if so, choose the option that states "Add all members." To improve viewing. locate the "Standard" dropdown option in the menu bar at the top of the screen. Click on that dropdown and choose "Entire View." You can hover over the data points to get the Salesperson and the amount. Required: 4a. Which Salesperson has the highest sales for January? What is the amount? 4b. Which Salesperson has the 2nd-highest sales for April? What is the amount? 4c. Which Salesperson has the lowest sales for July? What is the amount? 4d. Which Salesperson has the lowest sales for September? What is the amount? 4e. Which Salesperson has the 2nd-highest sales for December? What is the amount? Print References 4-a. Highest sales for January Amount 4-6. Second highest sales for April Amount 4-c. Lowest sales for July Amount 4-d. Lowest sales for September Amount 4-6. Second highest sales for December Amount A B D E F G H Store ID Store State 1002 Tennessee 1002 Tennessee 1007 Arkansas 1003 North Carolina 1009 Louisiana 1004 Georgia 1010 South Carolina 1007 Arkansas 1003 North Carolina 1008 Alabama 1003 North Carolina 1002 Tennessee 1006 Florida 1007 Arkansas 1009 Louisiana 1003 North Carolina 1006 Florida 1003 North Carolina 1006 Florida 1010 South Carolina 1004 Georgia 1003 North Carolina 1003 North Carolina 1005 Mississippi 1001 Virginia 1005 Mississippi 1006 Florida 1003 North Carolina 1006 Florida 1003 North Carolina 1005 Mississippi 1005 Mississippi 1003 North Carolina 1002 Tennessee 1009 Louisiana 1002 Tennessee 1002 Tennessee 1009 Louisiana 1005 Mississippi 1005 Mississippi 1004 Georgia 1009 Louisiana 1001 Virginia Dunder Company + Salesperson Andy Helms Robert Spader Erin Kemper Angela Nunez Brian Malone Jan Hardin Phyllis Lieberstein Nellie Tate Angela Nunez Pete Lacy Meredith Flannery Robert Spader Gabe Woods Erin Kemper Leslie Hudson Angela Nunez Holly Ryan Meredith Flannery Creed Scott Oscar Kinsey Roy Denman Angela Nunez Stanley Baker Kelly Kaling Pam Fischer Darryl Robinson Gabe Woods Angela Nunez Gabe Woods Meredith Flannery Darryl Robinson Kelly Kaling Keven Baumgartner Ryan Novak Leslie Hudson Robert Spader Robert Spader Brian Malone Darryl Robinson Kelly Kaling Toby Smith Brian Malone Dwight Wilson Order Month July September August February April June February April May October November May August May March July June September March May September June March February April July June May March January June July March March August August October August October May June February September Order Prod Cedar Maple Maple Oak Maple Maple Maple Oak Maple Pine Maple Cedar Cedar Cedar Walnut Maple Maple Pine Cedar Maple Oak Maple Pine Pine Oak Maple Walnut Oak Cedar Cedar Cedar Cedar Walnut Cedar Walnut Oak Cedar Walnut Maple Maple Walnut Maple Walnut $ $ $ $ $ $ $ $ $ $ $ $ $ $ $ $ $ $ $ $ $ $ $ $ $ $ $ $ $ $ $ $ $ $ $ $ $ $ $ $ $ $ $ Order Amount 773,375 150,201 244,772 323,242 94,571 283,713 784,383 1,321,076 756,568 276,966 656,434 336,250 1,190,325 295,900 575,856 339,343 511,796 730,548 880,975 751,005 112,432 1,029,155 754,632 497,736 365,404 973,525 1,962 1,292,968 228,650 181,575 618,700 1,170,150 911,772 309,350 695,826 934,591 67,250 1,263,684 328,217 433,914 1,055,736 506,233 1,215,696 110 fx A G H TUU > $ $ $ 0 1 2 3 4 5 6 7 8 9 $ $ 00 ONM $ $ $ $ $ $ $ $ $ 1 2 3 4 5 6 7 8 9 0 1 2 3 4 5 6 7 8 9 1005 1005 1004 1009 1001 1006 1007 1002 1005 1003 1002 1001 1001 1009 1009 1005 1008 1006 1002 1001 1001 1006 1010 1010 1005 1005 1004 1003 1003 1008 1006 1001 1005 1004 1002 1004 1001 1001 1009 1010 1005 1004 1008 B LUUTSalla Mississippi Mississippi Georgia Louisiana Virginia Florida Arkansas Tennessee Mississippi North Carolina Tennessee Virginia Virginia Louisiana Louisiana Mississippi Alabama Florida Tennessee Virginia Virginia Florida South Carolina South Carolina Mississippi Mississippi Georgia North Carolina North Carolina Alabama Florida Virginia Mississippi Georgia Tennessee Georgia Virginia Virginia Louisiana South Carolina Mississippi Georgia Alabama DITAI Vidiure Darryl Robinson Kelly Kaling Toby Smith Brian Malone Dwight Wilson Creed Scott Nellie Tate Ryan Novak Darryl Robinson Meredith Flannery Robert Spader Pam Fischer Michael Carell Brian Malone Leslie Hudson Kelly Kaling Clark Duke Creed Scott Andy Helms Dwight Wilson Jim Krasinski Creed Scott Phyllis Lieberstein Oscar Kinsey Kelly Kaling Kelly Kaling Jan Hardin Angela Nunez Meredith Flannery Pete Lacy Holly Ryan Pam Fischer Kelly Kaling Roy Denman Andy Helms Jan Hardin Pam Fischer Jim Krasinski Leslie Hudson Oscar Kinsey Kelly Kaling Roy Denman Pete Lacy D Hugust October May June February September December August January October July January July May August December March August July June February October March March February May January January September June September February November December January May August September January October June September January November E VITTUL Maple Maple Walnut Maple Walnut Walnut Cedar Pine Cedar Oak Maple Maple Walnut Cedar Oak Walnut Cedar Maple Maple Cedar Oak Oak Cedar Cedar Pine Walnut Oak Walnut Oak Oak Oak Walnut Walnut Maple Pine Walnut Walnut Maple Pine Pine Oak Walnut Maple is in si in si s nisi s sin siis $ $ $ $ $ $ $ F 1,203,00 328,217 433,914 1,055,736 506,233 1,215,696 1,103,724 322,800 264,924 309,350 288,107 122,386 406,099 767,808 1,250,850 400,539 359,910 383,325 495,107 228,083 127,775 484,863 358,377 289,175 457,300 409,428 367,908 864,321 455,886 400,539 541,079 618,376 983,754 1,463,634 194,705 614,142 175,956 1,503,624 467,292 497,736 742,590 358,377 639,840 445,040 $ $ $ $ $ $ 00 ONM $ $ 1 2 3 4 5 6 7 8 9 0 1 2 $ $ $ $ $ $ $ $
Step by Step Solution
There are 3 Steps involved in it

Get step-by-step solutions from verified subject matter experts