

Question: Is my answer wrong or right? Thanks Suppose that the school/college teaching the class is also recorded for each class (for example, Business, Engineering, Humanities
Is my answer wrong or right? Thanks
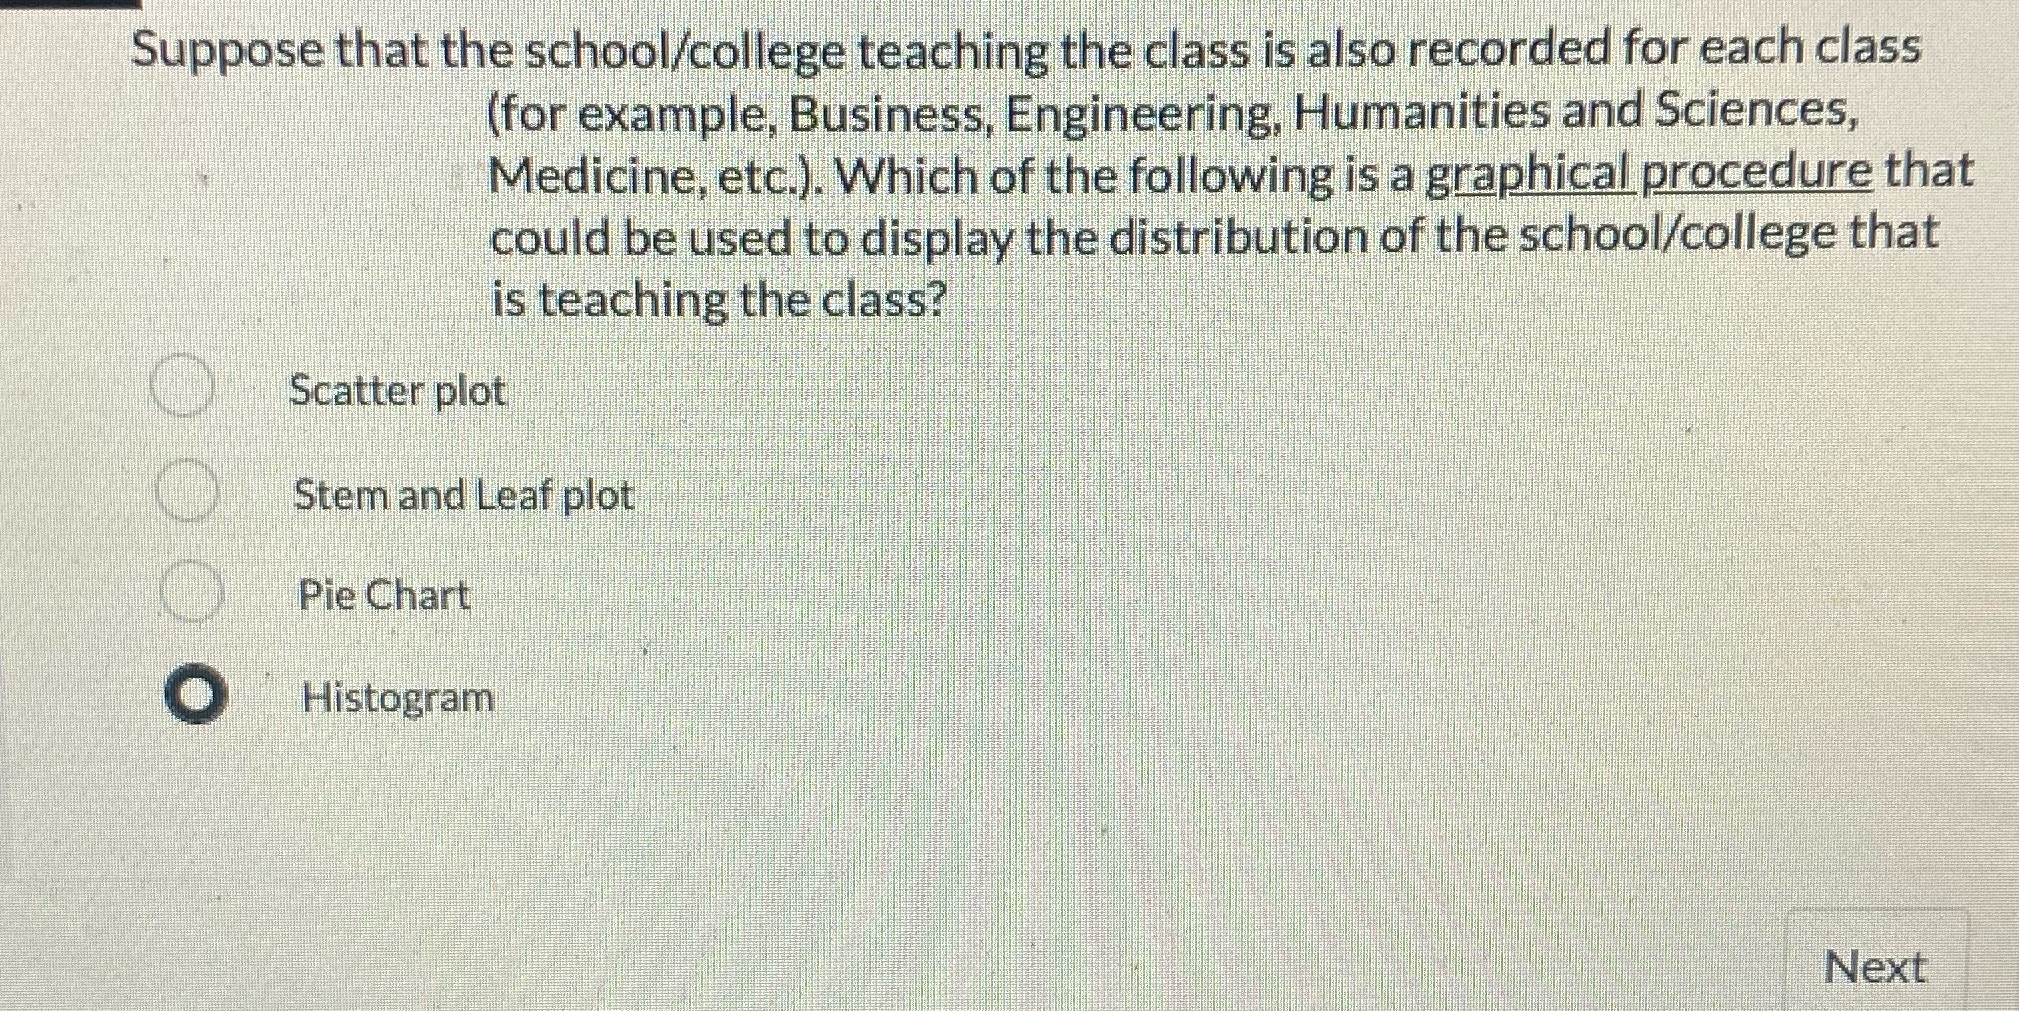
Suppose that the school/college teaching the class is also recorded for each class (for example, Business, Engineering, Humanities and Sciences, Medicine, etc.). Which of the following is a graphical procedure that could be used to display the distribution of the school/college that is teaching the class? Scatter plot Stem and Leaf plot Pie Chart Histogram Next
Step by Step Solution
There are 3 Steps involved in it
1 Expert Approved Answer
Step: 1 Unlock

Question Has Been Solved by an Expert!
Get step-by-step solutions from verified subject matter experts
Step: 2 Unlock
Step: 3 Unlock