

Question: Is the association observed between the two variables in the sample simply due to chance? Or, can you say that it reflects an association that
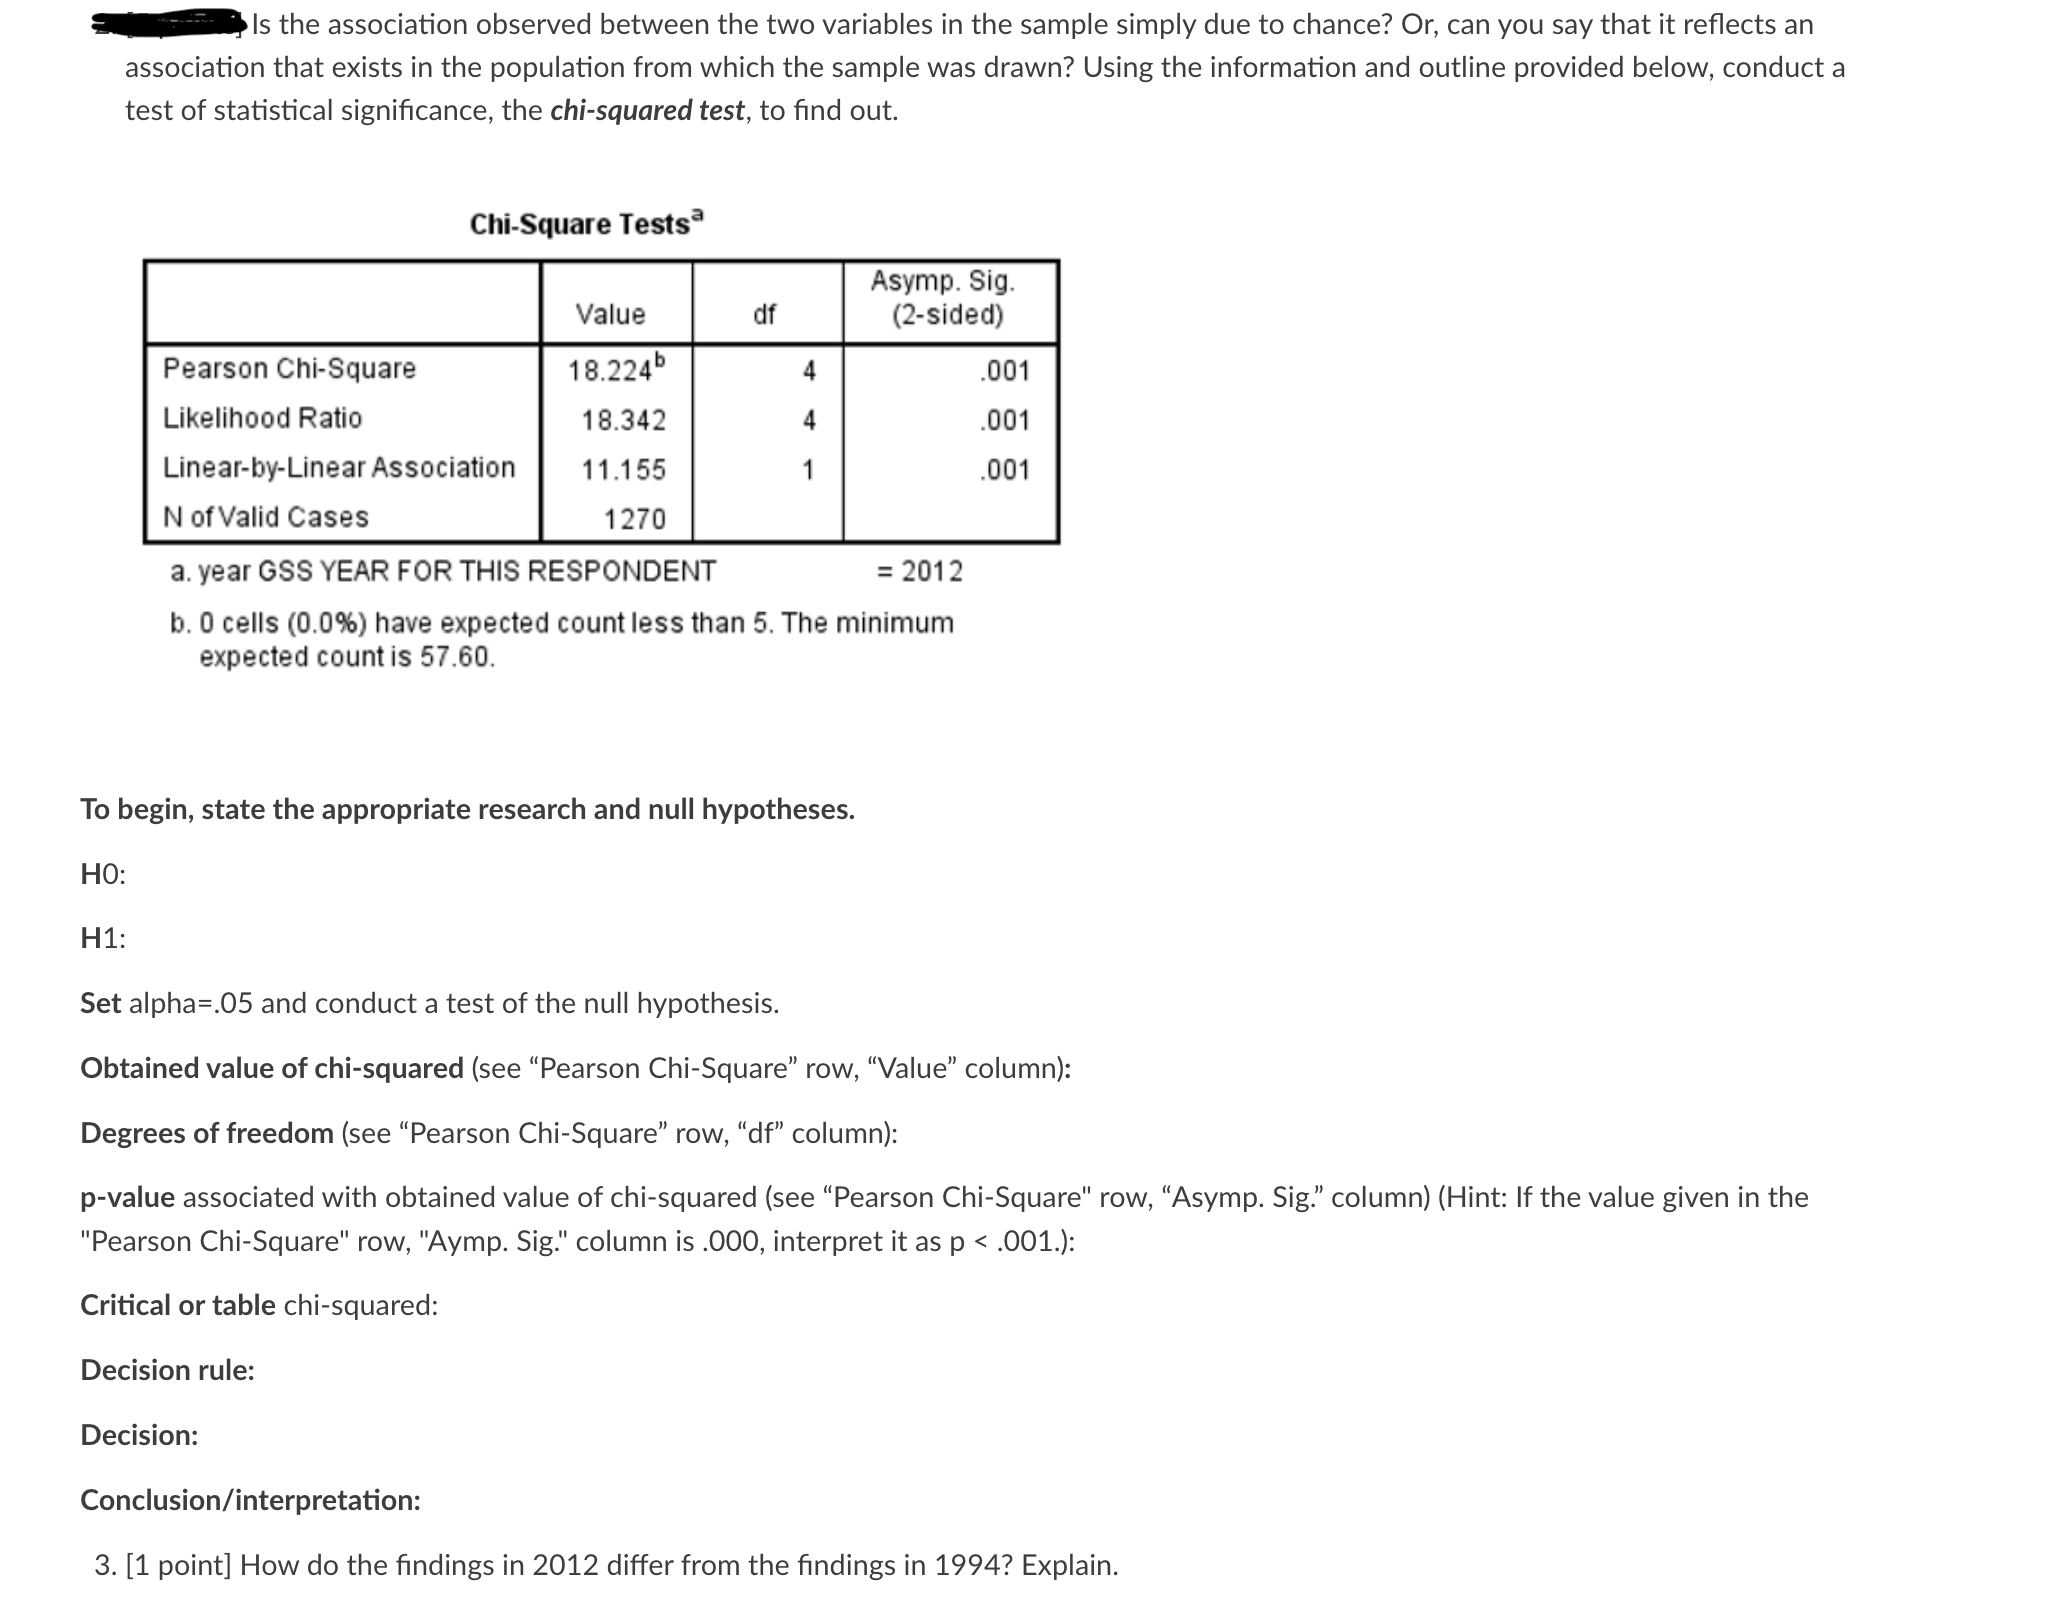


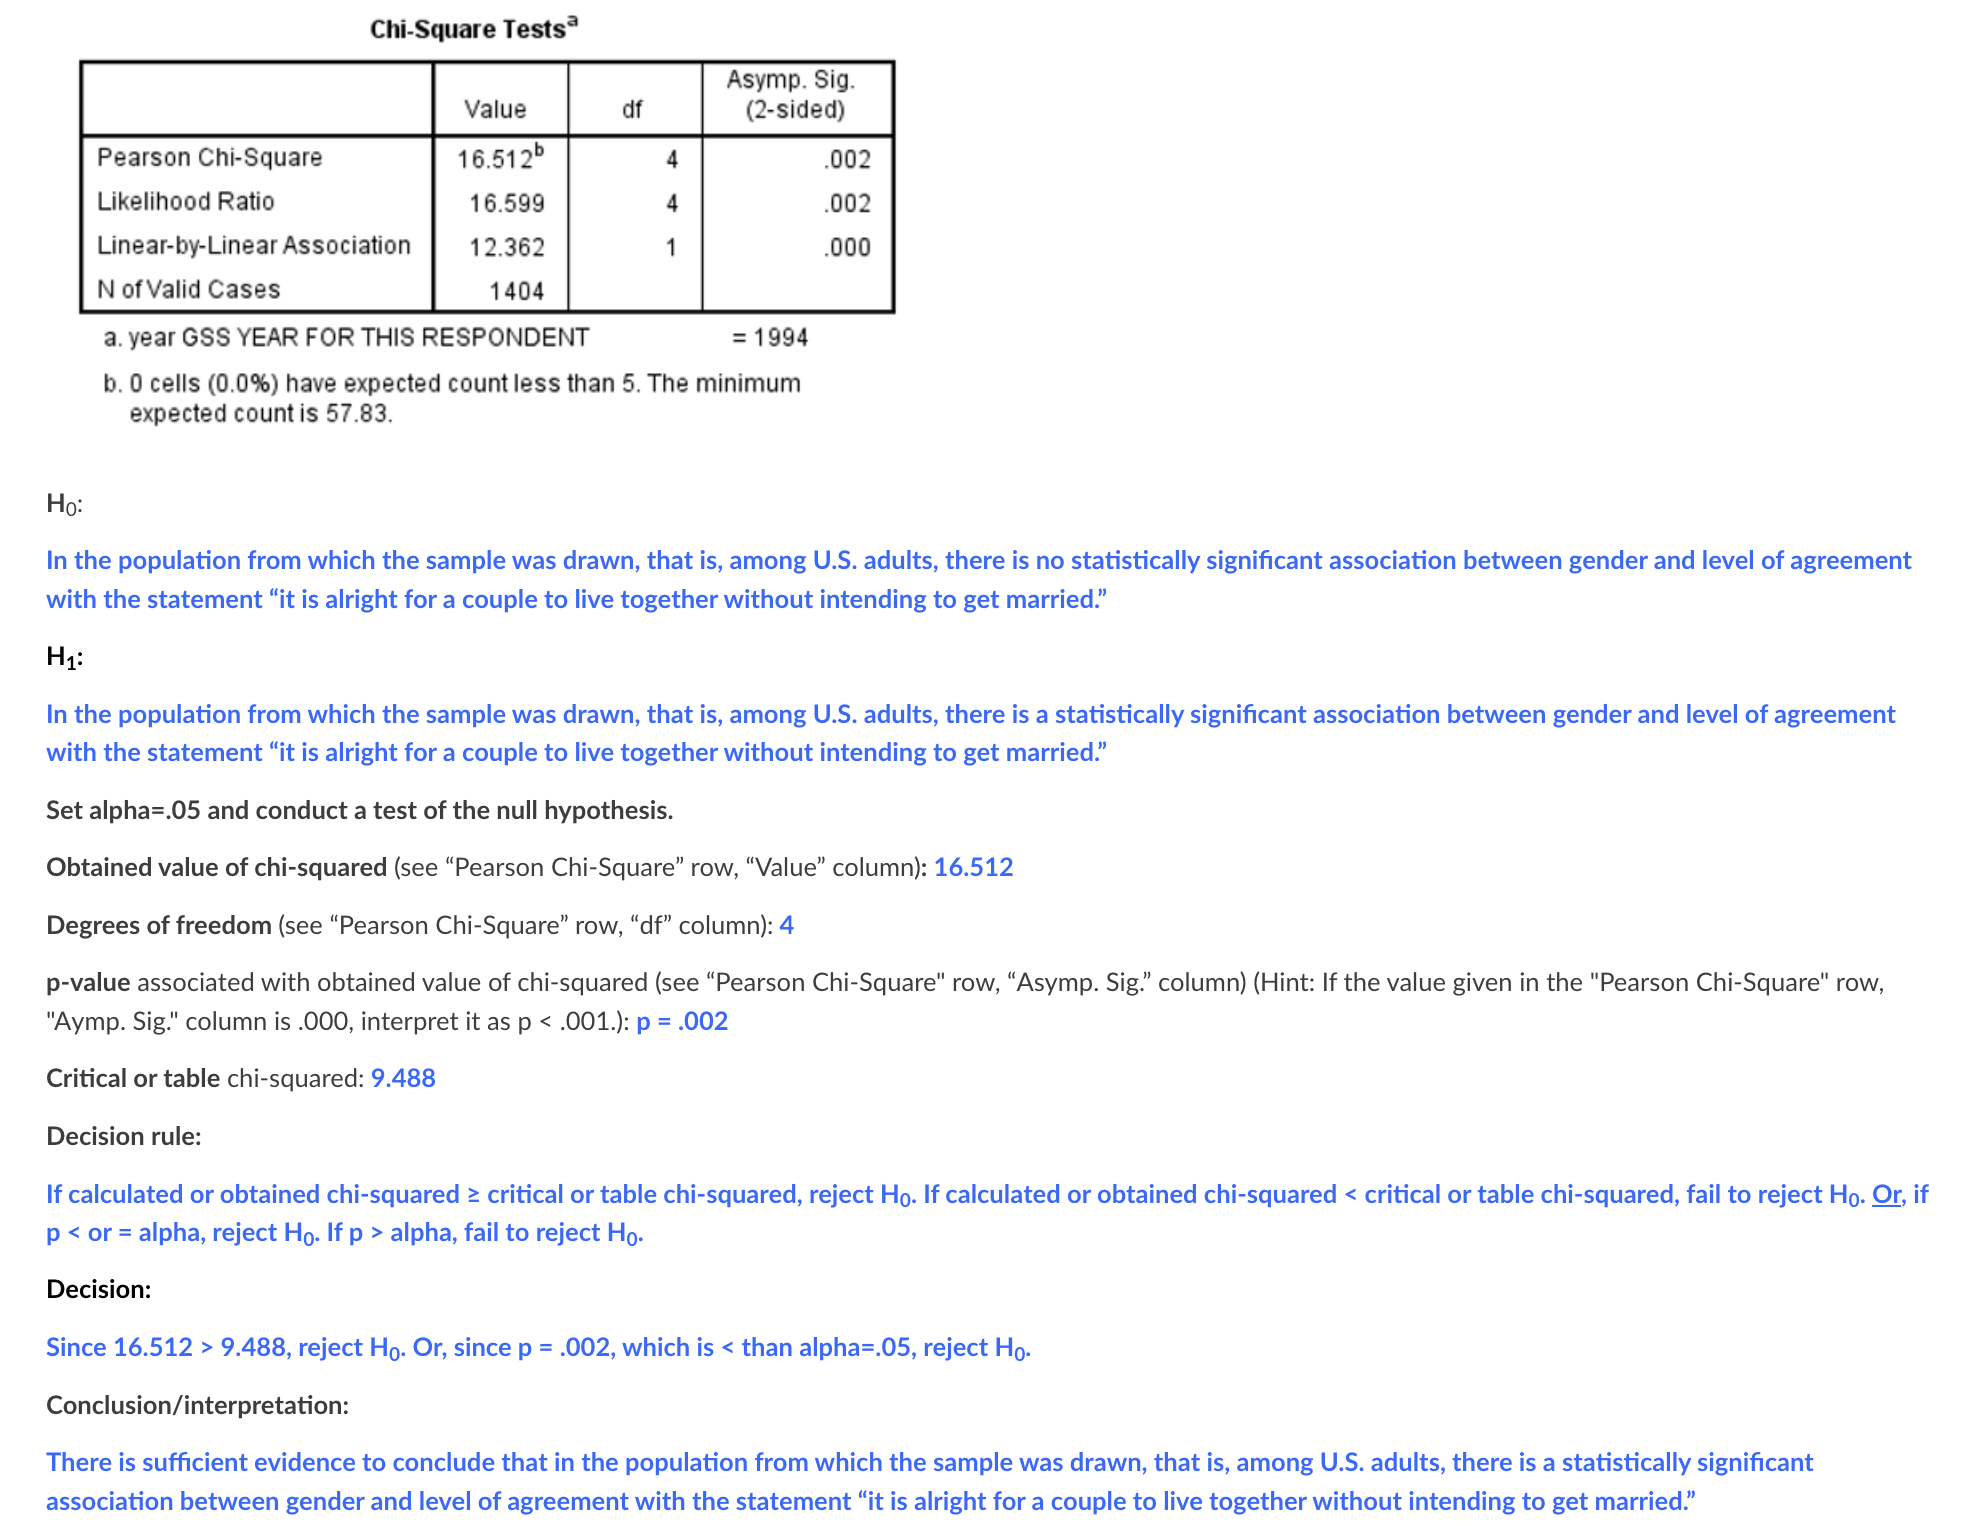
Is the association observed between the two variables in the sample simply due to chance? Or, can you say that it reflects an association that exists in the population from which the sample was drawn? Using the information and outline provided below, conduct a test of statistical significance, the chi-squared test, to find out. Chi-Square Tests Asymp. Sig. Value df (2-sided) Pearson Chi-Square 18.224 001 Likelihood Ratio 18.342 001 Linear-by-Linear Association 11.155 001 N of Valid Cases 1270 a. year GSS YEAR FOR THIS RESPONDENT = 2012 b. 0 cells (0.0%) have expected count less than 5. The minimum expected count is 57.60. To begin, state the appropriate research and null hypotheses. HO: H1: Set alpha=.05 and conduct a test of the null hypothesis. Obtained value of chi-squared (see "Pearson Chi-Square" row, "Value" column): Degrees of freedom (see "Pearson Chi-Square" row, "df" column): p-value associated with obtained value of chi-squared (see "Pearson Chi-Square" row, "Asymp. Sig." column) (Hint: If the value given in the "Pearson Chi-Square" row, "Aymp. Sig." column is .000, interpret it as p alpha, fail to reject Ho. Decision: Since 16.512 > 9.488, reject Ho. Or, since p = .002, which is
Step by Step Solution
There are 3 Steps involved in it

Get step-by-step solutions from verified subject matter experts